Executive Summary Dashboard
Use this article to view, customize, and analyze performance using the Analytics Express dashboard.
Overview
Analytics Express helps you track key metrics over time, compare performance against previous periods, and quickly navigate to detailed reports for deeper analysis.
Analytics Express is a long-term performance tracking dashboard designed to show trends across revenue, bookings, and operational metrics.
Access the Analytics Express Dashboard
Go to Data & Insights.
Select Analytics beta.
If your business has access, Zenoti opens the Executive Summary dashboard page.
The Analytics Express dashboard includes:
Header filters for time selection and comparisons
Quick overview metrics
KPI widgets with trend charts and insights
Use Time Filters
You can filter data using predefined or custom ranges, including:
Week-to-date (WTD)
Month-to-date (MTD)
Quarter-to-date (QTD)
Year-to-date (YTD)
Previous month
Last 6 months
Fiscal week
Custom date range (up to last 2 completed years)
Fiscal week availability depends on your organization’s week-start setting. Fiscal week selection is available only at the center level.
Warning
When you select the Custom date range, Zenoti disables comparison against previous periods.
Compare Performance
You can compare selected periods against the previous year; this is the default selection.
Comparison is available only when the selected period is not custom.
Understand KPI Widgets
Analytics Express displays multiple KPI widgets, including:
Collections
Sales
Appointments
Bookings by source
Provider utilization rate
Guest feedback
Add-ons
Liabilities
Packages
Liability-based membership
Gift cards
Each widget:
Displays trends based on the selected time range
Adjusts time granularity automatically (daily, weekly, monthly, or quarterly)
Includes a View details link for reconciliation
Includes a KPI Definitions & Help option
Has a Pin on overview option for inclusion in the Quick overview section
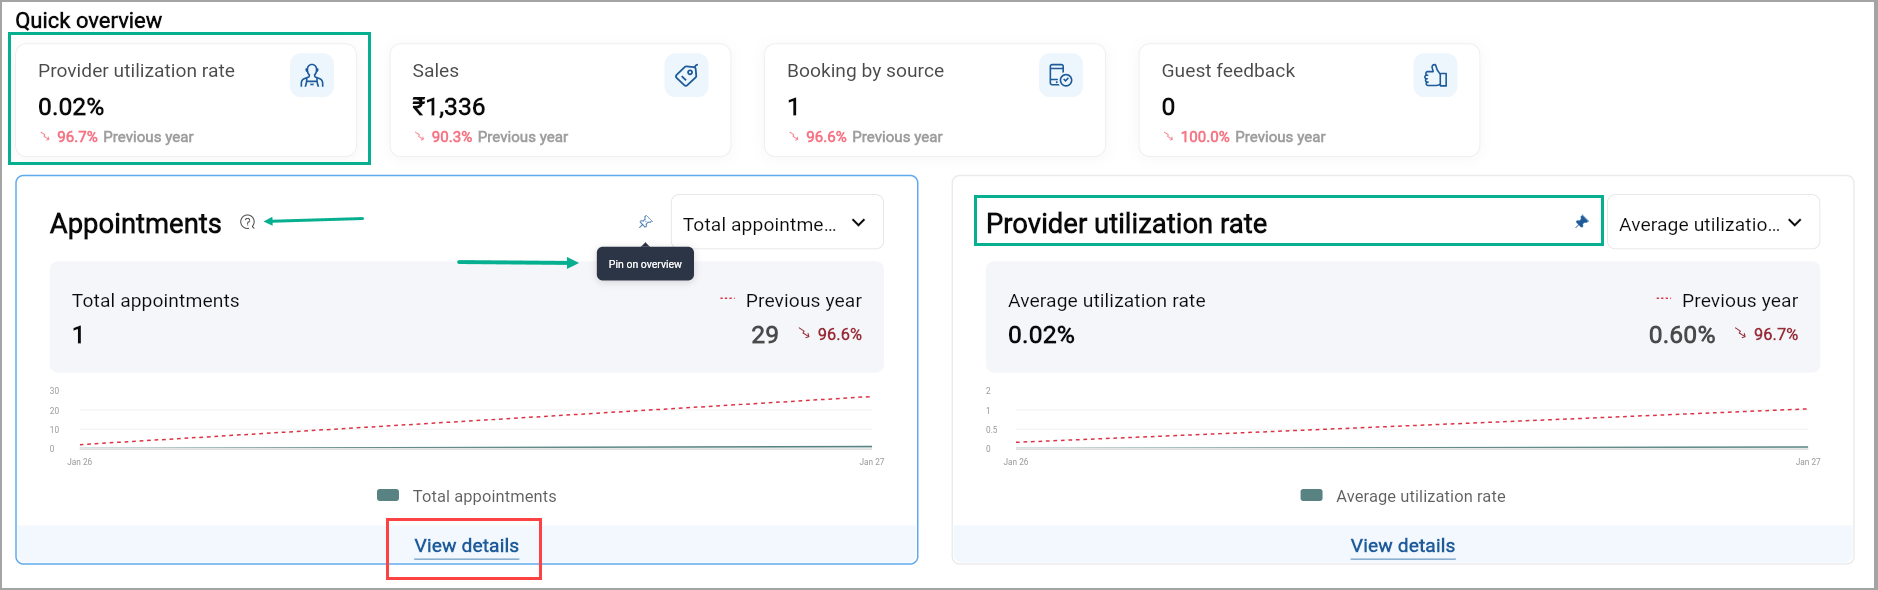
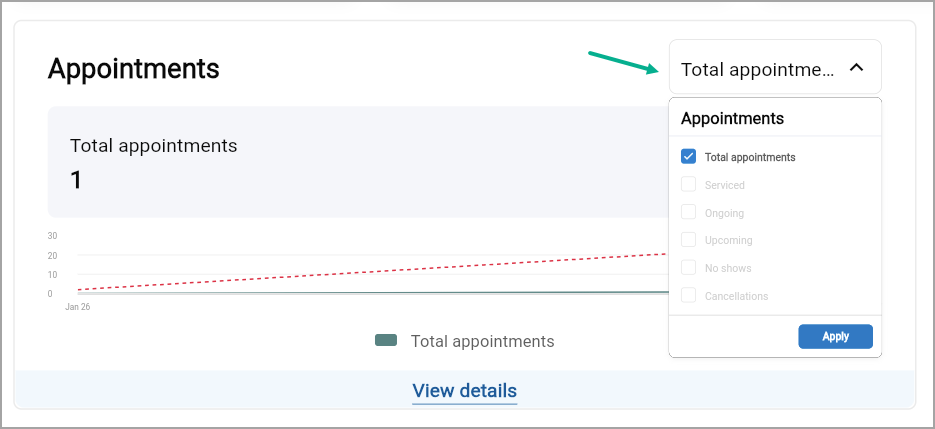
The green line on each widget represents data related to the current time period, while the red dotted line represents data from the previous year. Each widget also includes a drop-down list to filter data.
Navigate to detailed reports
When you select View details on a widget, Zenoti redirects you to the relevant core report.
Configure KPI Widgets
If your role allows configuration, you can customize which widgets appear on your dashboard.
Click the Configure icon.
Choose the KPI widgets you want to display.
Reorder widgets as needed.
Save your layout.
Configuration Rules
You must select at least two widgets.
There is no maximum limit.
Zenoti saves configurations per user.
Tip: Customize widgets based on what you review most often to reduce scrolling.
Manage Permissions
Admins control access using role permissions.
Go to Admin > Security Roles
Select a role
Open the Permissions tab
Search for Analytics Express – Executive Summary
Enable View or Configure
Save changes
Considerations
Center managers and owners have View and Configure access by default.
Other roles require explicit permission.