Organization Level Analytics in HyperConnect
The organization-level analytics in HyperConnect gives you a consolidated view of performance across all your locations from a single dashboard. It allows business owners, regional managers, or corporate admins to monitor the health, engagement, and service performance of all connected centers from one place. that helps you see how all your locations are performing, how customers are engaging, and whether your call and SmartBot systems are operating efficiently — without needing to check each center individually.
How this Analytics helps customers
Consolidated Visibility: Eliminate the need to log into each location dashboard and see everything in one view.
Improved Decision-Making: Identify trends, measure SmartBot adoption, and spot underperforming centers instantly.
Enhanced Customer Experience: Use Google Ratings and Flagged Calls data to improve service quality and customer satisfaction.
Operational Efficiency: Analyze call volumes to plan staffing, manage missed calls, and improve response times.
Performance Benchmarking: Compare centers, recognize top performers, and replicate best practices across the organization.
Access the organization-level analytics dashboard
Launch HyperConnect.
From the location selector drop-down list select Org level.
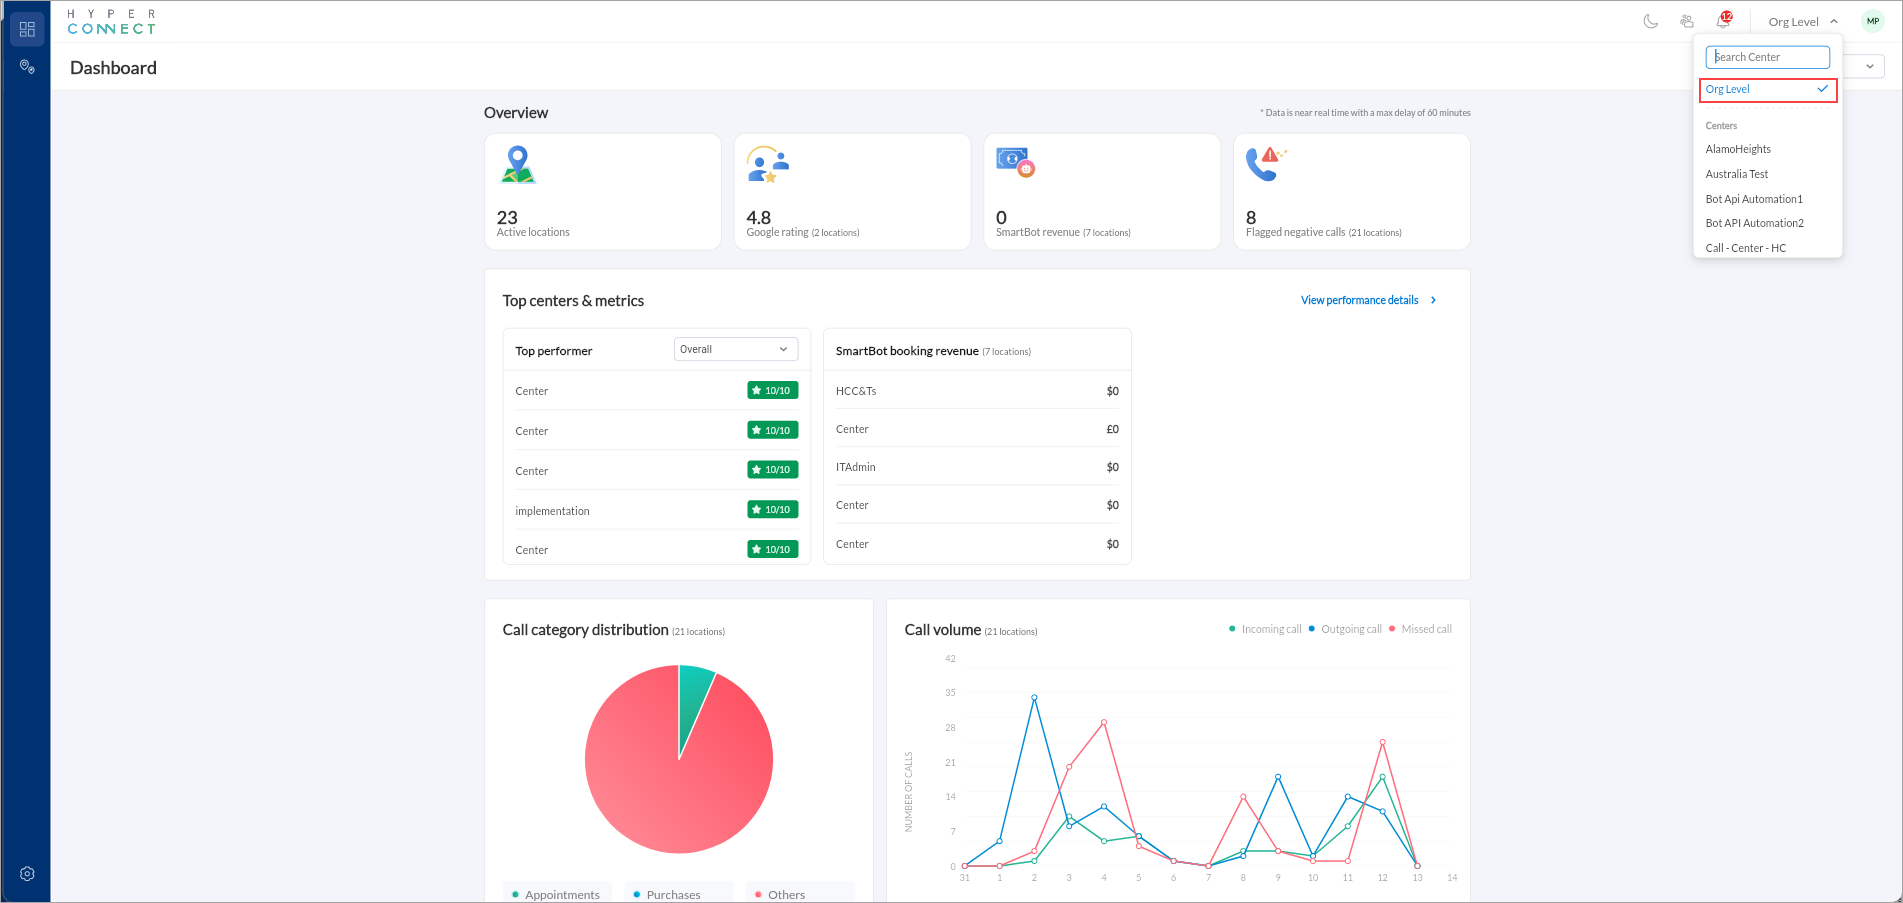
Overview section
The top section shows four key metrics that provide a quick snapshot of your organization’s overall performance:
Active Locations: Number of centers currently integrated and reporting data through HyperConnect.
This helps confirm data coverage and allows you to quickly see if all centers are synced.
Google Rating: Shows the average customer rating across all locations that have integrated their Google accounts.
It gives an instant view of customer satisfaction and brand reputation.
SmartBot Revenue: Displays total revenue generated by SmartBot across locations.
It helps you measure the effectiveness of your SmartBot adoption and automation ROI.
Flagged Negative Calls: Represents the total number of calls flagged for negative sentiment or poor customer experience.
Helps managers identify where service quality may need improvement.
Top Centers and Metrics
This section identifies your best-performing locations based on selected criteria.
Top Performer List:
Shows a leaderboard of centers ranked by overall performance score. The dropdown filter (“Overall”) allows you to switch ranking criteria. Example: by SmartBot Revenue or Google Rating.
It helps identify which centers are performing best and which may need coaching or support.
SmartBot Booking Revenue Table:
Shows how much revenue each location has generated through SmartBot-driven bookings.
If all show $0, that usually means SmartBot is not yet live at those centers, or No transactions have been attributed to SmartBot bookings in this period.
Call Category Distribution (Pie Chart)
Shows where most customer interactions are happening and highlights areas for categorization improvement.
Call Volume (Line Chart)
Visualizes incoming, outgoing, and missed calls across locations over time. It helps you monitor communication patterns, identify peaks in missed calls, and optimize staffing accordingly. The color coding signifies the following:
Green: Incoming calls
Blue: Outgoing calls
Red: Missed calls
Location Performance Dashboard in HyperConnect
The Location Performance view gives you a deeper look at how each individual center is performing within your organization. While the Org-Level Dashboard shows consolidated metrics, this section helps you compare locations side-by-side, identify top performers, and spot centers that may need additional support.
Access the location performance dashboard
You can access this screen by clicking the Location Performance icon in the left menu, when you are in Org Level mode.
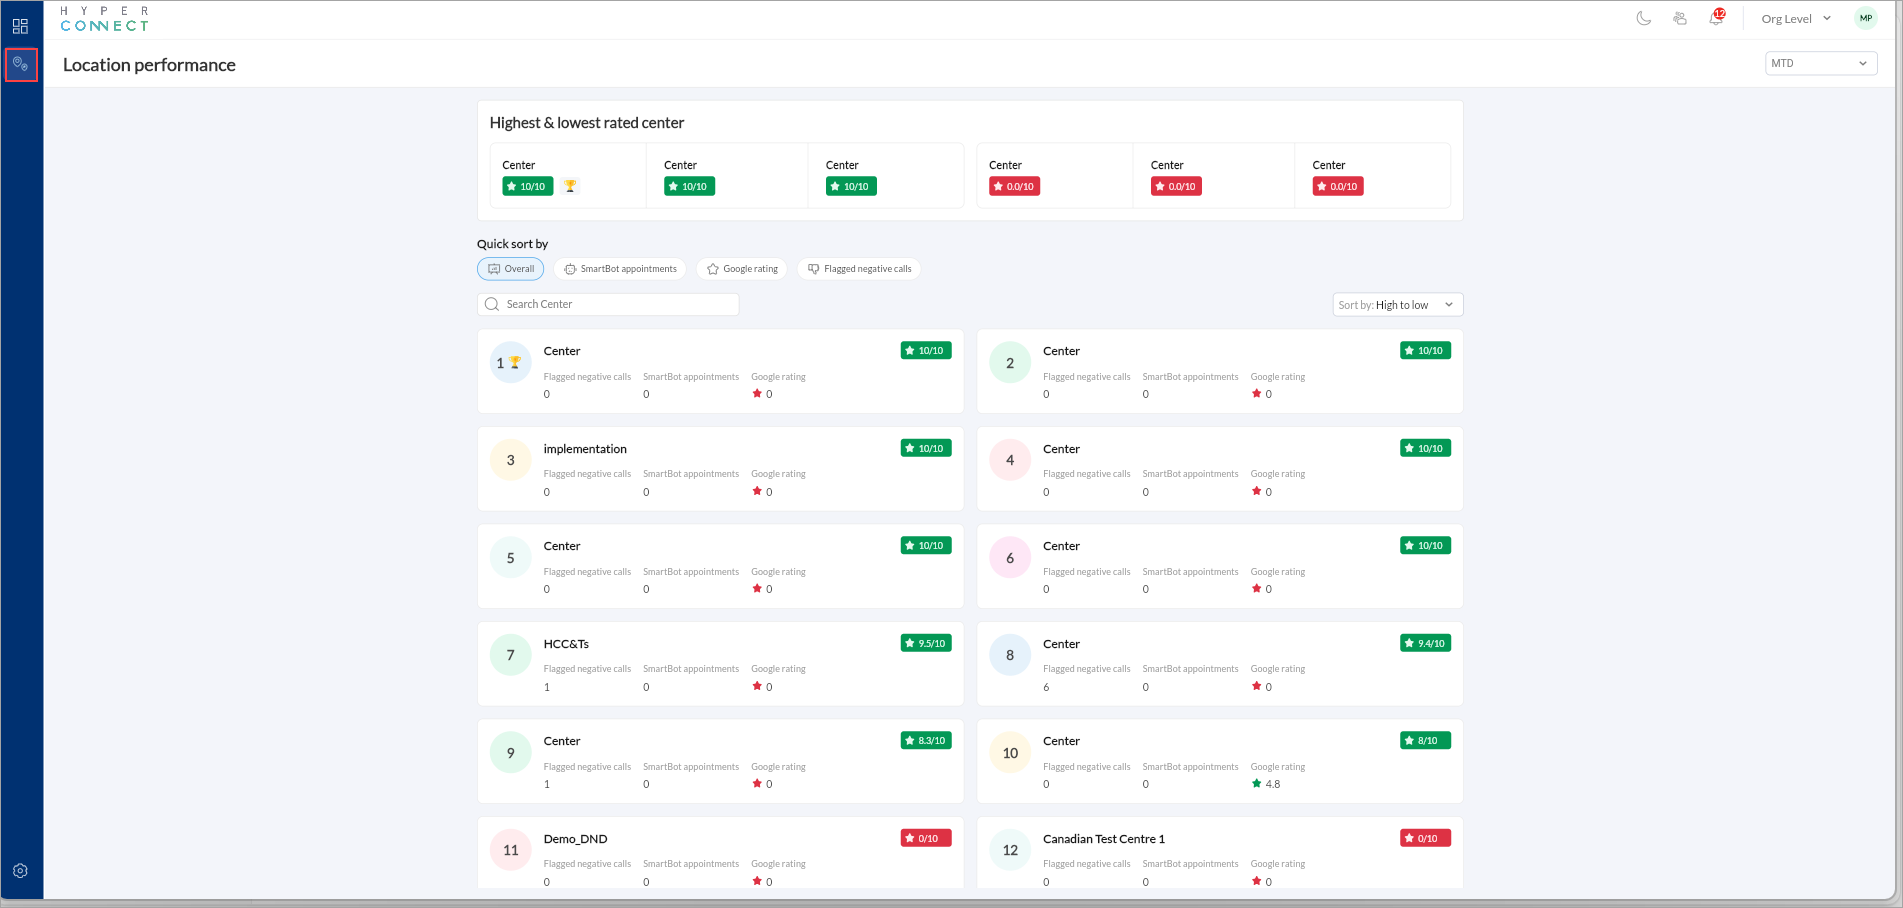
What this screen shows
Highest and Lowest Rated Centers: This gives you a quick understanding of which locations are performing exceptionally well and which ones require attention.
At the top of the page, you will see a snapshot of:
Top-rated centers (green cards)
Lowest-rated centers (red cards)
Ratings are calculated based on a combination of:
SmartBot appointments
Google Rating
Flagged Negative Calls
Quick Sort Options: This flexibility helps you analyze performance through different lenses. You can quickly sort your centers based on specific metrics
Overall Score
SmartBot Appointments
Google Rating
Flagged Negative Calls
You can also use the search bar to quickly find a specific center.
You can sort the list High to Low or Low to High depending on your objective.