Reports in HyperConnect
This article explains how to access and use the reporting features in HyperConnect to track performance metrics, monitor call volumes and call transfers, analyze guest booking behavior, and review flagged calls for quality assurance and service improvement.
Overview
The Reports feature in HyperConnect provides a centralized dashboard to monitor key business activities and agent performance. This helps businesses track appointment trends, identify abandoned bookings, and review flagged calls for quality assurance. These insights support better decision-making and service optimization.
Access Reports in HyperConnect
Launch HyperConnect.
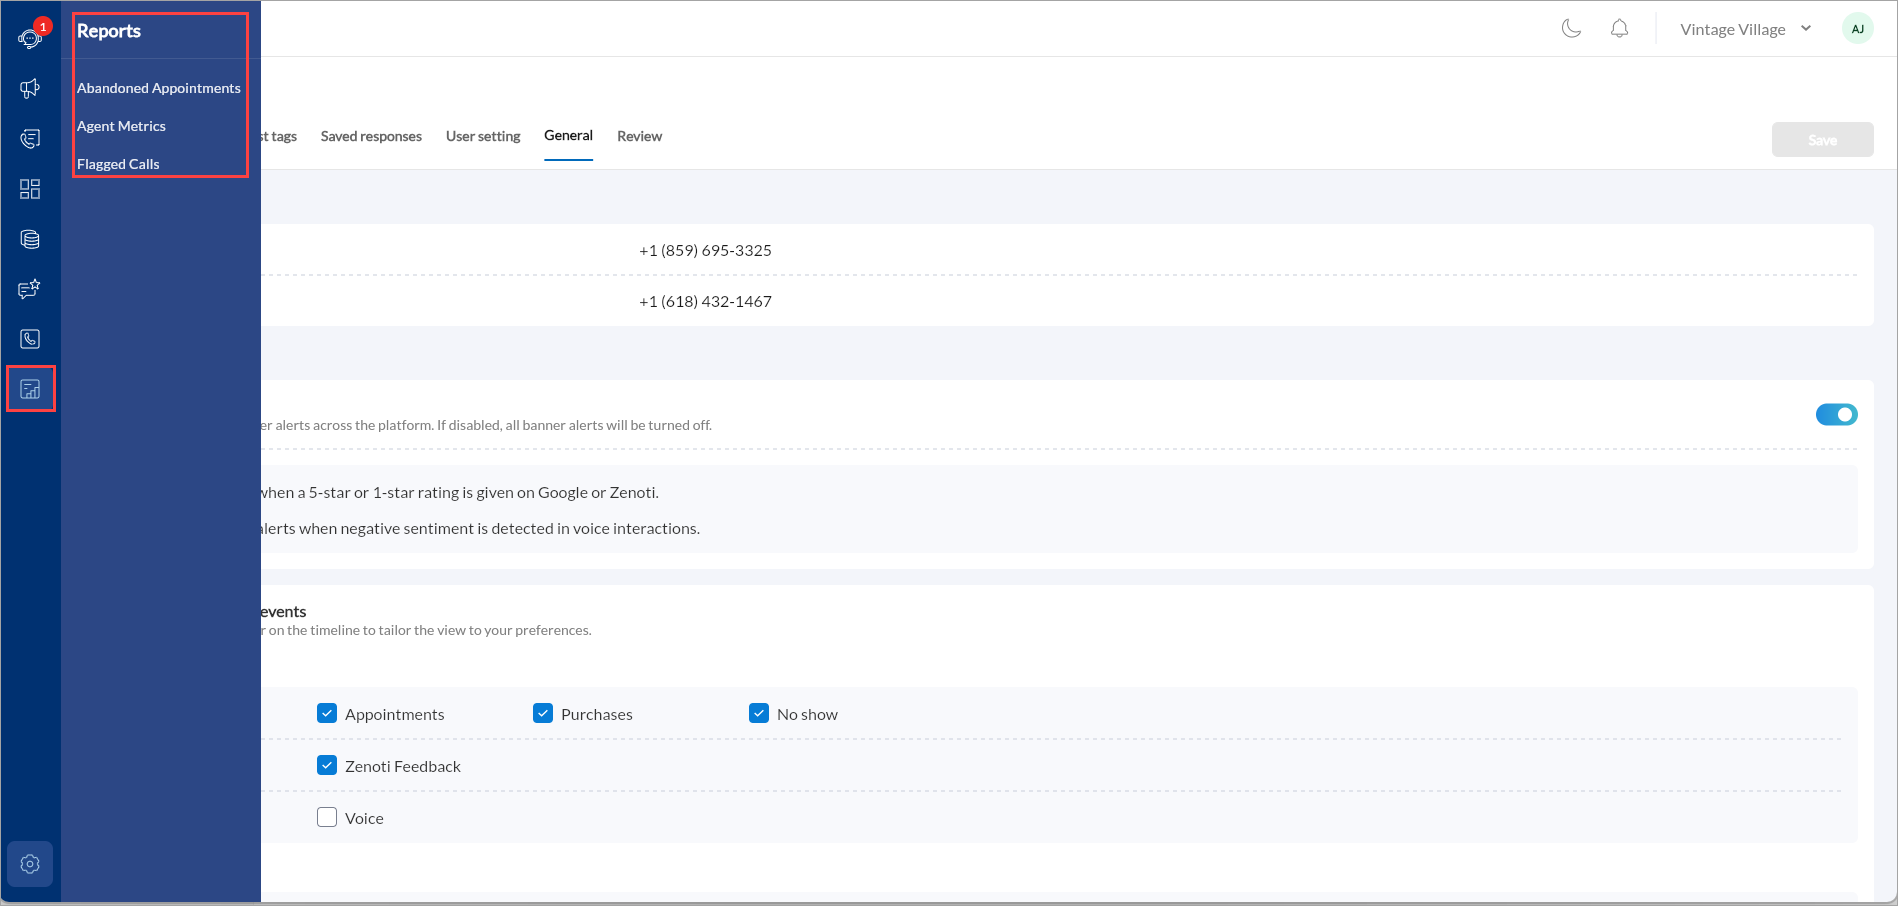
Navigate to Reports icon on the left navigation panel.
The available reports include:
Abandoned Appointments: A report that shows appointments initiated by guests but not completed within the selected time period.
Agent Metrics: A report that displays performance indicators related to team member communication activities during the selected time period.
Flagged Calls: A report that shows calls automatically marked by AI due to indicators such as negative sentiment during the selected time period.
Call Volume: A report that displays the total number of inbound, outbound, and missed calls handled during the selected time period.
MIssed Calls: A report that shows all incoming calls that were not answered by any team member during the selected time period.
Spam and Blocked Calls: A report that displays calls identified as spam or numbers that were blocked to prevent further communication during the selected time period.
Call Transfer: A report that shows calls redirected from one employee to another within the system during the selected time period.
Types of Reports
Abandoned Appointments Report
This report compiles all abandoned cart events, which are appointments that customers began booking but did not complete, into a single, consolidated view. Instead of reviewing each timeline event individually, you can quickly access all abandoned appointments at once and determine appropriate follow-ups.
Column | Description |
|---|---|
Guest Name | Name or number of the customer who abandoned the appointment |
Date | Date of the abandoned appointment event |
Time | Time the appointment was abandoned |
Service Requested | Service the customer was attempting to book |
Therapists | The assigned or suggested therapist for the service |
Agent Metrics Report
The Agent Metrics report provides a tabular view of all agent call data. It includes metrics critical for both call center performance and sales insights. Businesses can download the report for deeper analysis or filter by date ranges.
Column | Description |
|---|---|
Name | Name of the agent |
Calls | Total calls handled by the agent |
Calls Analyzed | Analyzed Calls analyzed by AI for sentiment and performance |
Average Rating | Average customer rating for the agent (out of 10) |
Average Time to Answer | Time (in seconds) taken on average to answer calls |
Average Call Duration | Average length of calls handled by the agent during the selected time period |
Positive Sentiment | Number of calls with positive sentiment (AI-detected) |
Negative Sentiment | Number of calls with negative sentiment (AI-detected) |
Neutral Sentiment | Number of calls with neutral sentiment |
Calls Received | Number of inbound calls answered |
Calls Made | Number of outbound calls placed |
Flagged Calls Report
The Flagged Calls report consolidates all calls flagged by AI due to negative sentiment or other quality concerns.
Managers can use this report to:
Review problem calls.
Identify training opportunities
Analyze why customer sentiment was negative.
Column | Description |
|---|---|
Call Type | Indicates inbound or outbound call |
Guest Name | Customer name or number |
Date | Date of the flagged call |
Time | Time the call took place |
Duration | Length of the call |
Agent Name | The agent who handled the call |
Call Category | Category assigned to the call. For example: others |
Call Volume Report
The Call Volume Report shows the total number of calls handled by the business over a selected period and allows for filtering and exporting the data in CSV or Excel format.
This report helps managers understand how many calls are being answered, missed, or canceled, and take corrective actions to improve responsiveness.
Key Features
View all calls (inbound, outbound, missed, and answered) in a single table.
Choose which columns/metrics to include.
Filter by date range (customizable).
Export to CSV or Excel.
See percentages (For example: percentage of calls answered or missed).
Helps compare performance with advanced systems like RingCentral.
Column | Description |
Date | The date on which the call occurred |
Calls | The total number of calls handled on that date |
Inbound | The total number of incoming calls received by the business during the selected period. |
Outbound | The total number of outgoing calls made by employees to customers or other numbers. |
Incoming answered | Count of inbound calls that were successfully answered |
Missed | The number of inbound calls that were not answered |
Connected | The total number of calls (inbound or outbound) that were successfully connected to another person |
Average call duration | The average length of all connected calls |
Percentage calls answered | The percentage of calls successfully answered within the selected range |
Percentage calls missed | The percentage of calls missed |
Percentage calls connected | The percentage of calls connected |
Percentage calls cancelled | The percentage of calls that were cancelled |
Call Transfer Report
The Call Transfer Report gives businesses greater visibility into how calls are being transferred between employees or departments. It helps managers understand who is transferring calls, who receives them, and how these transfers affect call duration and customer experience.
All the calls transferred between phone numbers. Call transfer volumes, or thsoe calls that were transferred to or by.
This report is particularly helpful for monitoring internal communication flow and ensuring that customer calls reach the right person efficiently.
Column | Description |
Date and Time | Shows the exact date and time when the call transfer occurred |
Guest Name | Displays the name of the guest or customer whose call was transferred |
Guest phone number | The phone number of the guest whose call was transferred |
Call transferred by | The employee who initiated the transfer of the call to another person or department |
Call transferred to | The employee or department that received the transferred call |
Duration after transfer | The total time the call continued after being transferred |
Filters
You can filter the report by:
Call Transferred By – View all calls transferred by a specific employee.
Call Transferred To – View all calls received by a specific employee or department.
Business Hours – Filter to view transfers that occurred during or after business hours, helping identify staffing or workload patterns.
These filters make it easy to narrow down the data and focus on specific call activities or time periods.
Missed Calls Report
The Missed Call Reasons Report gives businesses detailed visibility into not just how many calls were missed, but why they were missed. This allows businesses to:
View all missed calls in one place
Identify the specific reason for each missed call
See how many agents/devices the call rang
Identify which agent declined the call
Analyze trends and optimize call handling
Filter and export missed call data
This helps businesses move from simply tracking missed call volumes to actively improving call response performance.
What the report shows
The Missed Call Report lists every missed call along with its specific reason. A call may be marked as missed because:
An agent declined it
The caller disconnected while the phone was ringing
The call rang for the configured duration with no answer
Beyond the reason, the report also shows how many agents or devices the call rang before it was missed. If your call flow is configured to ring multiple devices sequentially, you can see exactly how far the call progressed.
If an agent declined the call, their name is recorded. If devices are being used, the report also reflects where the call was declined.
This provides a comprehensive view of what happened from the moment the call entered your system to when it was marked as missed.
The missed call reason filter allows you to filter the report by specific missed call reasons (For example: only declined calls, only caller drop-offs).
Column | Description |
|---|---|
Date and Time | The exact date and time when the call was received. |
Guest Name | The name of the caller, if the number is already associated with an existing guest profile. |
Missed Call Reason | The specific reason why the call was categorized as missed. |
Agents and Devices Reached | The total number of agents or devices that the call attempted to reach before being marked as missed. |
Agent Names | If the call was declined, this column shows the name of the agent who declined it. |
Devices Rang | Lists the specific devices that rang during the call attempt. |
Spam and Blocked Calls Report
The Spam and Blocked Calls Report provides businesses with visibility into unwanted or restricted incoming calls. It helps managers identify potential spam activity, review blocked numbers, and ensure legitimate calls are not mistakenly filtered.
This report includes calls that were automatically identified as spam by the system or manually blocked by your team. It helps maintain call quality, reduce disruptions, and protect employees from unwanted communications.
Monitoring this report regularly can help improve customer communication efficiency while minimizing time spent on non-legitimate calls.
Column | Description |
|---|---|
Date | Shows the exact date when the call was received. |
Time | Displays the specific time the call was received. |
Guest name | Displays the name associated with the incoming phone number, if available. |
Phone number | Shows the phone number of the caller that was marked as spam or blocked. |
Marked safe | Indicates whether a call previously identified as spam was reviewed and marked as safe for future communication. |
Blocked | Indicates whether the phone number has been blocked from contacting your business again. |
You can filter the report by date range to view the spam and blocked calls within a selected time period.