Campaign reports
Campaign Redemption report
The Campaign Redemption report lets you track all the campaign redemptions in a center. For all the discount campaigns active in the system, the report shows each redemption on an invoice along with the additional invoice details such as the guest who availed the discount, the item on which the discount is applied, the discounted amount, etc. This report focuses exclusively on sales from closed invoices where a campaign has been redeemed, making it the most reliable report for analyzing finalized campaign-driven sales.
Use this report,
To track the invoices on which the campaign was applied.
To track the number of users who redeemed the campaign. The number of unique invoices gives the number of users.
Note
If the invoice has two discounted items, each discounted item is shown individually against the same invoice number. To track the number of users when there are repeated invoices, copy the invoice numbers in an Excel sheet and use the Remove Duplicates command in the Data Tools group on the Data tab to remove the duplicate values.
Navigation
Follow these steps to navigate to the report:
Ensure that you are at the Center level.
On the Main menu, click the Reports tab.
On the Reports Dashboard, click Marketing > Redemptions (from the filter).
From the list of reports, select Campaign Redemption. The report opens in a new tab.
To export the report, on the top right side of the report, click the Excel icons.
Filter criteria
Criteria | Options | Description |
|---|---|---|
Campaign | Campaigns | Select the required campaign for which you want to view the redemptions. |
Time Period | 1 Month 2 Months 3 Months 6 Months Custom | Select a time period for the report. You can run the report for a predefined time period, or any custom time period of up to six months. The report shows campaign redemptions in the selected time period. |
Column descriptions
Column | Description | Additional Notes |
|---|---|---|
Code | Guest code. | |
Invoice No | Invoice number on which the campaign was applied. | |
Guest | Name of the guest who redeemed the campaign. | |
Item Name | Item name on which the campaign was applied. Item name is the name of the service, product, package, or membership. Ex: French Manicure, Sports Deep Tissue Massage, Bridal Package, etc. | If an invoice has 4 items, but the campaign is applied to only 2 items, then each of those items will be shown individually in the report. However, the invoice number will be the same for those two items. |
Item Type | Item type on which the campaign was applied. | Possible Values:
|
Discount Amount | Discount amount provided on the item. | |
Applied By | Name of the employee who applied the campaign. | |
Invoice Amount | Final invoice amount that was paid. | |
Closed Date | Date on which the invoice was closed. | |
Invoice Status | Status of the invoice. | Possible Values:
|
Total | Total amount given as discount as a result of running the campaign during the specified time period. |
Understand campaign metrics
Tip
Learn how you can understand campaign metrics
When you create campaigns for your business that sends email or text notifications to your guests, you'll want to monitor your campaign's performance. So this campaign-wise report shows you the performance of each report.
Zenoti allows you to easily access and view performance metrics in one glance on the Manage Email/Text Message Campaigns page.
You can use this report to view and determine which email/text campaigns are achieving performance goals.
Manage Email/Text Campaigns report
Use the Manage Email/Text Campaigns report to:
View the performance of campaigns for a selected time period
Status of campaigns
View the target segment used for a campaign
Note
Data is refreshed daily at 8 AM (center's time zone). So, for campaigns sent after this time, data is updated the following day.
Select the center for which you want to see the email/text campaign data.
Note
You can also access this report at the organization level.
On the main menu, click the Marketing tab.
On the Marketing dashboard, from the Campaigns list, select Email/Text Message.
Criteria | Options | Description |
Search box | Name or Code of a Campaign | You can use this search box to search for a campaign. |
Campaigns | Center Campaigns (default), All Campaigns |
|
Schedule | All Schedules (default), Always On, Scheduled |
|
Channels | All Channels (default), Email, Text Message (SMS), Push Notifications |
|
Status | All Status (default), Live, Paused, Scheduled, Delivered, Not Scheduled, Failed |
|
Schedule dates | Today, Yesterday, Tomorrow, Last 7 days, Last 14 days, Last 30 days, Last week, Last month, Last quarter, Week-to-Date, Month-to-Date, Last Month-to-Date, Last 3 Months-to-Date, Last 6 Months-to-Date, Last 12 Months-to-Date, Quarter-to-Date, Half Year-to-Date, Year-to-Date, Current Month, Current Quarter, Current Half Year, Next Month, Next Quarter, Custom | Select to filter campaigns scheduled in the specified timeframe. Use Custom to specify a date range. |
Last updated on | Today, Yesterday, Last 7 days, Last 14 days, Last 30 days, Last week, Last month, Last quarter, Week-to-Date, Month-to-Date, Last Month-to-Date, Last 3 Months-to-Date, Last 6 Months-to-Date, Last 12 Months-to-Date, Quarter-to-Date, Half Year-to-Date, Year-to-Date, Current Month, Current Quarter, Current Half Year, Custom. | Select to filter campaigns that were last updated in the specified timeframe. Use Custom to specify a date range. |
Column | Description |
Code | The unique identifier associated with the campaign. |
Catalog | Click to navigate to the Webstore setup page where you can manage how the campaign should appear in the Webstore. |
Name | The name assigned to your campaign. Click to view campaign details. |
Target segment | The target segment associated with the campaign. Click to view details of the target segment. |
Campaign status | Current status of the campaign. Click to view the history of statuses related to the campaign. |
Created date | The date on which the campaign was created. |
Schedule date | The date when the next email or text campaign is scheduled to be sent to the guest. |
Deliver rate (%) | The ratio of the total number of emails delivered to the total emails sent (Total Delivered /Total Sent). Click to view details of recipients to whom the email was delivered. |
Open rate (%) | The ratio of the total number of emails opened to the total number of times an email was delivered (Total Opened /Total Delivered). Click to view details of recipients who opened the email. |
Click through rate (%) | The ratio of the total clicks by the recipients to the total number of times an email was delivered. (Total Clickthroughs /Total Delivered). If a guest opens or clicks through an email multiple times, the total sum will only consider each metric once per click for a unique guest. Click to view details of recipients who clicked links in the email. |
Click to open rate (%) | The ratio of the total number of links clicked by a recipient to the number of times the email was opened (Total Clicks / Total Opened). Click to view details of recipients who clicked links in the email. NoteOnly a unique click is counted for each recipient that clicked a link in the email. |
Bounce rate (%) | The ratio of total emails that returned a soft bounceback (Total Failed sends /Total attempted sends). Click to view details of recipients who did not receive the email as it was not delivered due to an email bounce. NoteA soft bounceback is an email that was temporarily not delivered. The reason for soft bounceback could be either that the recipient's inbox was full, the campaign email message was too large, or the mail server was unavailable. However, these bounces may still be delivered at another time. |
Conversion rate (%) | The ratio of the total number of campaigns converted into potential business to the number of times campaigns are delivered (Total Conversions / Total Delivered). |
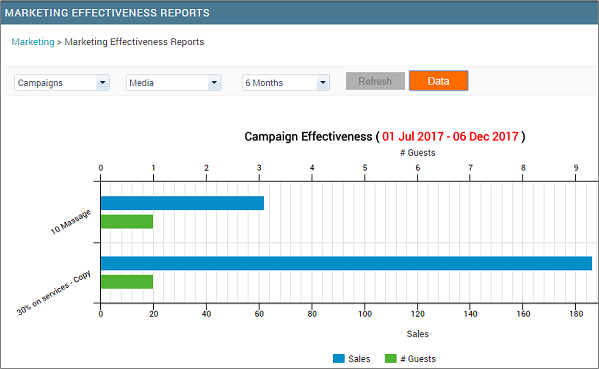
Track the effectiveness of a media campaign
We are in the final step - Tracking. Zenoti helps you track the effectiveness of your media campaigns.
Go to Reports > Marketing > Campaigns.
On the Marketing Effectiveness Report page, select the options as explained in the image below.
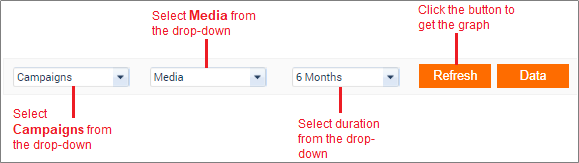
To view the graph, click Refresh.
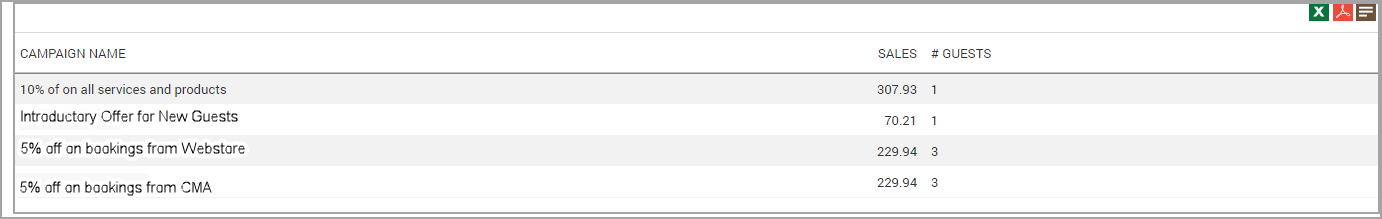
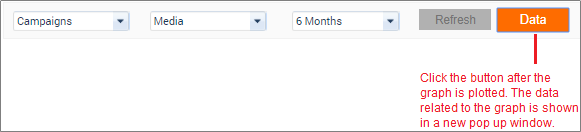
If you would like to see the sales and number of guests in a tabular form then, click Data.
The sales number shown in the report is the total of the invoice.
The number of guests shown in the report is the number of unique guests.