Introduction to Signals
Signals provide key insights that can help you understand the impact of Zenoti on your business. The metrics are calculated over a rolling cycle of three months, and only show up on the dashboards if the data has improved in the past three months.
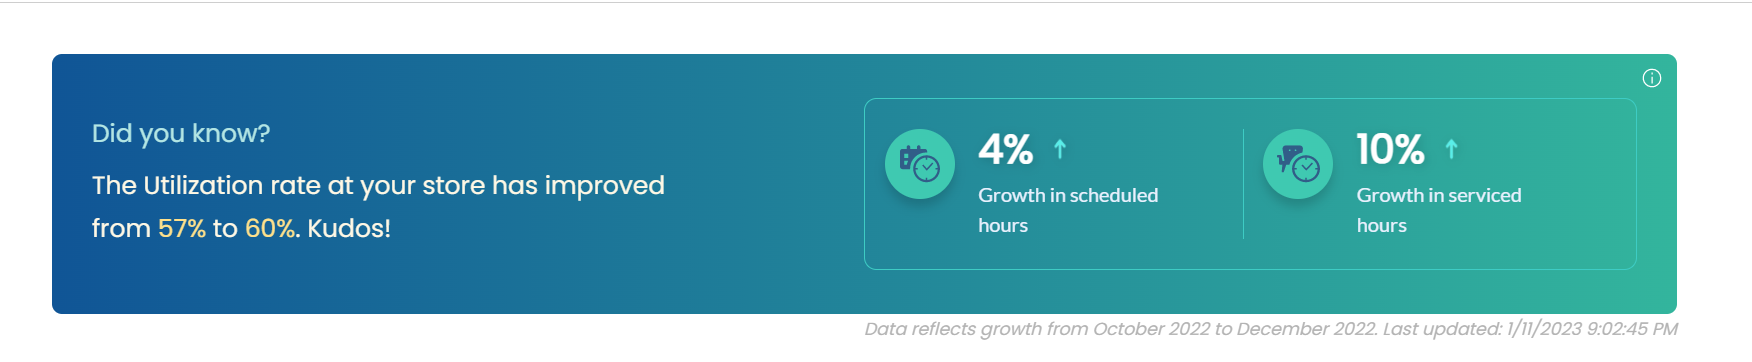
Signals are composed of multiple contributors. The top two contributors in the past three months, called impact drivers, are displayed along with Signals.
Signals are displayed to the following users:
Page | Role |
|---|---|
Admin Dashboard | All owners and managers |
Marketing Dashboard | All owners, managers, and marketing managers |
Signals you see depend on the relevance and impact to your business.
Example
Consider that today’s date is December 5, 2022. The following table lists three metrics for the past three months:
Metric | September | October | November |
Average spend per visit | 100 | 95 | 130 |
Utilization percentage | 30 | 35 | 33 |
Total Sales | 10000 | 11000 | 9000 |
The following tables lists signals that you see in December:
Metric | Signal for December | Reason |
Average spend per visit | Did you know? Average spend per visit at your store has grown by 30%. Impressive. | The average spend per visit has increased from 100 to 130 between September and November. |
Utilization % | Did you know? The Utilization rate at your organization has improved from 30% to 33%. Kudos! | The utilization % has increased from 30 to 33% between September and November. |
Total Sales | Not displayed | The total sales have decreased from 10000 in September to 9000 in December. As there is a decrease in the metric, this metric will not be displayed. |
Signals and definition
Signals provide you the following metrics to help you understand how your business has improved over the past three months:
Signals on Admin Dashboard
Role permissions to view Signals on Admin dashboard
To grant a user permission to view signals on the Admin dashboard, follow these steps:
At the organization level, click the Configuration icon.
Navigate to Security > Security roles.
Select a role and click the Permissions tab.
Expand the Data & Insights section, and for Admin Signals, select the View checkbox.
The following table lists the signals on admin dashboard:
Signals | Contributors | Definitions and key points |
|---|---|---|
Total collections Payments through monetary instruments (cash, card, check, and custom payments) during the selected date range, irrespective of the invoice status. Tax is included. | Service collections | Payments collected for services through monetary instruments (cash, card, check, and custom payments) during the selected date range, irrespective of the invoice status. Tax is included. Day packages is not included in service collections. |
Product collections | Payments collected by selling products through monetary instruments (cash, card, check, and custom payments) during the selected date range, irrespective of the invoice status. Tax is included. | |
Membership collections | Payments collected by selling memberships through monetary instruments (cash, card, check, and custom payments) during the selected date range, irrespective of the invoice status. Tax is included. | |
Package collections | Payments collected by selling packages through monetary instruments (cash, card, check, and custom payments) during the selected date range, irrespective of the invoice status. Tax is included | |
Gift card collections | Payments collected by selling gift cards through monetary instruments (cash, card, check, and custom payments) during the selected date range, irrespective of the invoice status. Tax is included. | |
Total visits Number of invoices with sale date within the selected date range. Multiple invoices on the same day by the same guest and at same center are considered as one visit only. Visit can be for any item type. Refunds, recurring invoices, automatic payments, and freeze fees are not considered as a visit. Example:
| New guest visits | Number of visits for guests who do not have a prior ‘visit’ on any previous day. |
Existing guest visits | Number of visits minus New guest visits | |
Avg spend per visit Invoice final sale price (including discount and excluding tax)/Number of Visits. Final sale price is considered after redemptions. | Avg spend - New guest | Invoice final sale price (including discount and excluding tax) for new guests/Number of Visits by new guests. Final sale price is considered after redemptions. |
Avg spend - Existing guest | Invoice final sale price (including discount and excluding tax) for existing guests/Number of Visits by existing guests. Final sale price is considered after redemptions. | |
Avg spend – Self- service | Multiple invoices on the same day by the same guest and at same center are considered as one visit only. A visit can either be classified as self-service or assisted visit. A visit is considered as self-service when at least one of the item types has either Kiosk or Webstore or CMA or Shopify. Invoice final sale price (including discount and excluding tax) where visit is termed as a self-service visit)/number of total self-service visits. Final sale price is considered after redemptions. | |
Avg spend - Assisted service | Multiple invoices on the same day by the same guest and at same center are considered as one visit only. A visit can either be classified as self-service or assisted visit. Visit is considered at guest, store and day level. A visit is considered as self-service, when at least one of the item type has either Kiosk or Webstore or CMA or Shopify. If all the items have offline as the source, then the visit is considered to be assisted-service. Invoice final sale price (including discount and excluding tax) wherevisit is termed as self-service visit)/# of total self-service visits. Final sale price is considered after redemptions. | |
Average guest rating Average feedback rating (on a scale of 1 to 5) for invoices serviced during the time period where feedback is submitted. Example: If your store had 100 invoices in a month, out of which you have received feedback for 30 invoices. Average guest rating = (Sum of the feedback ratings from invoices with feedback)/30 | Happy visits | Number of invoices serviced during the selected time period with feedback greater than or equal to 4. Example: If your store had 100 invoices, with 20 invoices having a feedback. Out of these 20 invoices, 4 invoices received 4* rating, and 6 invoices received 5* rating. The number of happy visits in this example is 4+6=10. |
Unhappy visits | Number of invoices serviced during the selected time period with feedback lesser than or equal to 3. Example: If your store had 100 invoices, with 20 invoices having a feedback. Out of these 20 invoices, 2 invoices received 1* rating, 3 invoices received 2* rating and 3 invoices received 3* rating. The number of unhappy visits in this example is 2+3+3=8 | |
Self-service booking % Appointments created from Web, Mobile App, or Kiosk as a percentage of all appointments created during the selected time period. Example: If total bookings for a store is 100, where 20 bookings came from web, 10 bookings from app, 2 bookings from Kiosk, and 68 bookings from other (walk-ins, calls). Self-service booking% = (20+10+2) *100/100 = 32% | Webstore booking | Appointments created from Web as booking source during the selected time period. Webstore booking % = 100*Webstore bookings/Total bookings |
CMA booking | Appointments created from CMA as booking source during the selected time period. CMA booking % = 100*CMA bookings/Total bookings | |
Kiosk booking | Appointments created from Kiosk as booking source during the selected time period. | |
Utilization rate (Service hours + Recovery hours + Paid block hours)/(Scheduled hours) Example: Service Hours: 25 Paid Block Out Hours: 20 Mandatory Break Hours: 30 Total Scheduled: 170 Employee Utilization (%): 44.11% | Total scheduled hours | Sum of scheduled hours during the selected time period for providers who have status as Working. |
Serviced hours | Sum of service time for appointments serviced in the time period. For appointments with segments- the sum of the service time for each segment is considered. This does not include Recovery time. | |
Recovery hours | Configured duration (in hours) required by the provider to set things in order after completing a service and be ready for the next service. | |
Paid block out hours | Configured duration required by the provider for personal or other breaks. | |
Feedback fill rate Ratio of appointments that have feedback submitted to the total number of appointments. | Growth in appointments with feedback | Increase in appointments in which a guest has submitted feedback. |
Growth in total appointments | Increase in the total number of appointments. | |
Growth in appointments with happy customers | Increase in appointments in which a guest has submitted 4 or 5 star rating. | |
Front desk hours saved Amount of time Zenoti has saved for front desk staff by digitalizing the booking process through self-service appointments | Growth in self-service bookings | Increase in bookings through self-service channels, such as Webstore, CMA, and Kiosk. |
Growth in utilization rate | Increase in utilization rate (Service hours + Recovery hours + Paid block hours)/(Scheduled hours) | |
Service product bundle For any visit, when service is bought along with buying a product, it is considered as service product bundle | Growth in service product bundle visits | Increase in visits where a guest has bought products along with a service. |
Growth in total visits | Increase in total visits. | |
Social Booking Growth rate of of guests who reached your Webstore through the Book now buttons on your organization's Facebook and Instagram pages, and through the Reserve with Google buttonfrom the Google search results page. | Growth in Facebook bookings | Growth rate of guests who reached your Webstore through the Book Now button on your organization's Facebook page. |
Growth in Instagram bookings | Growth rate of guests who reached your Webstore through the Book Now button on your organization's Instagram page. | |
Growth in Reserve with Google bookings | Growth rate of guests who reached your Webstore through the Reserve with Google button from the Google search results page. |
Signals on Marketing Dashboard
The following table lists the signals on the marketing dashboard:
Signals | Contributors | Definitions and key points |
|---|---|---|
% of visits with discount 100*Visits with discounts/Total visits | Growth in total visits | Increase in total visits. |
Growth in visits with discounts | Increase in visits in which a guest has bought at least a service with discounts. | |
Package sales | Growth in number of packages sold | Increase in the number of packages sold. This is the net value of packages after returns are subtracted. |
Growth in average package size | Average package size = Package sales/Number of packages sold Tax is not included | |
Gift card sales | Growth in number of gift cards sold | Increase in the number of gift cards sold. This is the net value after returns are subtracted. |
Growth in average gift card size | Average gift card size = Gift card sales/Number of gift cards sold Tax is not included | |
Membership collections Membership collections = Recurring membership collections + Non-recurring membership collections | Growth in recurring membership collections | Increase in collections from recurring memberships. Tax is included |
Growth in non-recurring membership collections | Increase in collections from non-recurring memberships. Tax is included | |
Memberships growth Growth in memberships = New memberships - Cancelled memberships - Expired memberships Growth% = 100*Growth in memberships/Initial Membership count | Growth in new memberships | Growth in memberships = New memberships - Cancelled memberships - Expired memberships |
Decline in canceled memberships | Decrease in the number of cancelled memberships. | |
Decline in expired memberships | Decrease in the number of expired memberships. | |
Referral % New guests through referrals / Total new guests | Growth in number of new guests via referrals | Increase in the number of new guests through referrals. |
Growth in number of new guests | Total increase in the number of new guests. |
Reports reconciliation
Metric | Reconciliation | Notes |
|---|---|---|
Total collections |
| Day packages, Classes are currently not included in the total collections |
Service collections |
| Day packages are currently not included in service collections |
Product collections |
| |
Membership collections |
| |
Package collections |
| |
Gift card collections |
| |
Total visits |
| Appointment closed, invoice open can lead to data discrepancies |
New guest visits |
| Appointment closed, invoice open can lead to data discrepancies |
Existing guest visits |
| Appointment closed, invoice open can lead to data discrepancies |
Avg spend per visit |
| Appointment closed, invoice open can lead to data discrepancies |
Avg spend - New guest |
| Appointment closed, invoice open can lead to data discrepancies |
Avg spend - Existing guest |
| Appointment closed, invoice open can lead to data discrepancies |
Avg spend – Self- service |
| Appointment closed, invoice open can lead to data discrepancies |
Avg spend - Assisted service |
| Appointment closed, invoice open can lead to data discrepancies |
Average guest rating |
| |
Happy visits % |
| |
Unhappy visits % |
| |
Self-service booking % |
| |
Webstore booking |
| |
CMA booking |
| |
Kiosk booking |
| |
Utilization rate | (Service hours + Recovery hours + Paid block hours)/(Scheduled hours) Reconcile using the below metrics Total scheduled hours
Serviced hours
Recovery hours
Paid block hours
| |
Percentage of visits with discount |
|