Reports
Guest Feedback Summary (v2) report
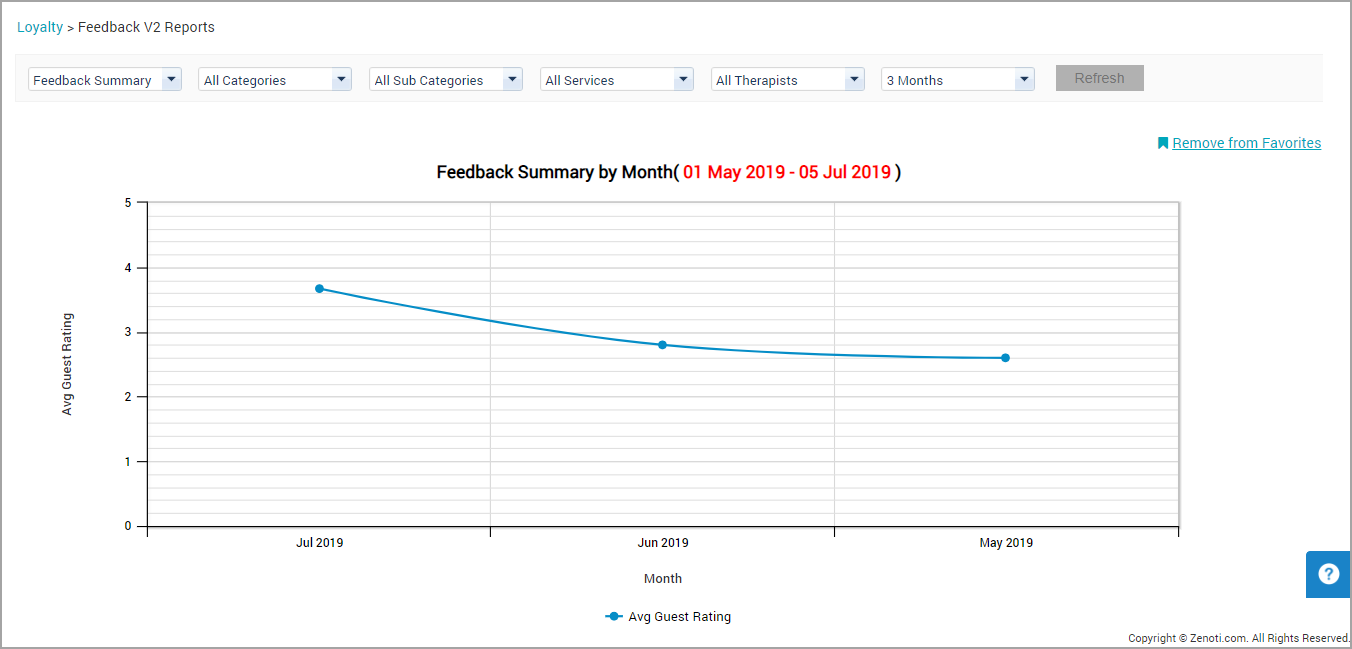
The Guest Feedback Summary (v2) report is a graphical report that helps business owners track trends of guest ratings at a glance in the selected time period. This chart is an indication of the health of the overall business - a continuous rating trend of 3 and above indicates that the business is doing well and can do better.
Note
From the Feedback Summary report business owners can see that the ratings improved from about 2.5 to over 3.5 over the past three months.
Business owners can then look at the Guest Feedback Details report to look at micro feedback details regarding aspects of business that can be improved such as Ambience, Providers, or Check-In/Checkout process.
Follow these steps to run the report:
Ensure you are at the center for which you want to run the report.
On the Main menu, click the Reports icon.
On the Reports Dashboard, click Loyalty > Feedback (V2) (from the filter).
Click Feedback Summary. The report opens in a new tab.
Select the appropriate filter criteria and click Refresh to see the report. Refer to the screenshot for more.
Filter criteria
Criteria | Options | Description |
|---|---|---|
Service Categories | Names of service categories | You can specify if you want to view the report for All Categories (of services) or any particular category such as say, Massages, Body Services, or Hair Service. |
Service Subcategories | Names of all Service Subcategories | You can specify if you want to view the report for All Sub Categories (of services) or any particular subcategory. For example, if you choose Body Services as the Service Category (in the previous filter), then you can choose from subcategories such as Body Wraps, Body Polishing, Body Scrubs, and Reflexology. |
Services | Names of individual Services | You can select All Services or any individual service. The services you see here vary based on your selections in the previous filters. For example, if you select Skin Services as the Service Subcategory earlier, the list of services you see here will be different from say, if you select Body Services. |
Provider | Names of individual Providers | You can select All Providers or the names of individual providers. |
Time Period | Today Last 7 days Last 14 day 1 month 2 months 3 months 6 months Custom | NoteBased on your requirement, from the drop-down list, select either today, last 7 or 14 days, 1, 2, 3, or 6 months. You can alternatively choose Custom from the list and specify custom dates. : For custom dates, you can view data for a maximum date range of 6 months at a time. Example: If you wish to see data from January to August, first view data from January to June and then view data from July to August. |
Report: Guest Retention Summary - by Service
The Guest Retention Summary - by Service report helps you review the retention rate for each category of service. It shows you number and percentage of guests that took a service in a given time period and came back and took another service (same or different service).
This report is useful to analyze the services that are doing well and the services that need improvement. For example, the report might show you that your guests seem to have a higher probability of returning if they try facials or massages and a lower probability if they try Salon Services. It could indicate that there are some improvements in the experience of Salon Services that the center needs to achieve.
For details on how to use the report, click the following button:
Report: Guest Retention Summary - by Center
The Guest Retention Summary - by Center report shows you information (number and percentage) related to guests who availed a service at your center during a specified time period, and came back to avail another service at a future date.
For details on how to use the report, click the following button:
Guest Retention Summary by Therapist report
Overview
The Guest Retention Summary - by Therapist report shows you the number and percentage of guests that took a service with a therapist in a given time period and came back for another service (same or different service) with the same or different therapist. This report is useful to analyze which therapist retained the most number of guests in a specified time period.
Important notes
Only appointments whose status is closed, are considered in this report.
This report can only be run for a single center. It doesn't take into consideration the appointments from other centers.
This report shows data only from the therapist’s base center. The therapist must have had appointments in the base center during the selected date range.
Do not compare the values generated in this report with any other guest retention report as the definition of retention in this report is different.
This report is only available if the checkbox against Guest Retention Summary is selected at the organization level, and the person accessing the report has access to loyalty reports.
Make sure you have selected the center for which you want to run the report.
On the Main menu, click the Reports tab.
On the Reports Dashboard, click Loyalty.
From the list of reports, click Guest Retention Summary. The report opens in a new tab.
Select By Therapist in the filter criteria and make other selections as per your requirement. Finally, click Refresh. The report opens.
To export the report, on the top right side of the report, click the Excel or CSV icon.
Filters
Criteria | Options | Description |
|---|---|---|
Guest Retention Summary filter | By Center, By Therapist, By Service | By Therapist option allows you to view number and percentage of guests that took a service with a therapist in a given time period and came back and took another service with the same or different therapist. This article has information only related to By Therapist filter criteria. To view information related to other filter criteria, see: |
Time Period | From Date, To Date | NoteBased on your requirement, specify From and To dates. You can view data for a maximum date range of 6 months at a time. Example: If you wish to see data from January to August, first view data from January to June and then view data from July to August. |
Retention Period | 15 Days, 30 Days, 45 Days, 60 Days, 90 Days, 120 Days, 180 Days, | Select the number of days into the future that you want to see the retention data. The days is calculated after the last day of the time period you specify. Example: If you select the time period as 15th September to 30th September, and you select the retention period as 60 days, when you generate the report, Zenoti checks if any of the guests who visited your center between 15th and 30th September availed another appointment within 60 days after 30th September (between 1st October and 29th November). |
Column descriptions
Column | Description |
|---|---|
Name | The name of the therapist who performed the service. |
# of New Guests | The number of guests who have booked an appointment at your center for the first time during the specified time period. |
New Guests Returning at least once to the same Therapist (#) | NoteThe number of new guests who returned for another appointment with the same therapist during the retention period. You must be aware of the following:
|
New Guests Returning to Other Therapists (#) | The number of new guests who returned for another appointment, but were serviced by a different therapist during the retention period. |
New Guests Retained (%) | Add # of New Guests Returning to the same Therapist and # of New Guests Returning to the Other Therapists. Divide this number by # of New Guests, and derive the percentage. This is the percentage of new guests retained. |
Repeat Guests (#) | The number of guests for who, the appointment during the specified time period, is not the first appointment. |
Repeat Guests Returning to the same Therapist (#) | NoteThe number of repeat guests who returned for another appointment with the same therapist during the retention period. You must be aware of the following:
|
Repeat Guests Returning to other Therapists (#) | The number of repeat guests who returned for another appointment, but were serviced by a different therapist during the retention period. |
Repeat Guests Retained (%) | Add # of Repeat Guests Returning to the same Therapist and # of Repeat Guests Returning to the Other Therapists. Divide this number by # of Repeat Guests, and derive the percentage. This is the percentage of repeat guests retained. |
Turnaways report
The Turnaways report lets you track the key details pertaining to turnaways in a selected time period, including the guest and service details, and the reasons for the turnaways.
Navigation
Follow these steps to run the report:
Make sure you have selected the center for which you want to run the report.
On the main menu, click the Reportstab.
On the Reports Dashboard, click Operational, and under the Operational section, click Appointments.
From the reports list, select Turnaways.
Click Refresh to view the results. To export the report, on the top right side of the report, click the Excel or CSV icon.
Filter Criteria
Criteria | Options | Description |
|---|---|---|
Employee | By default, the report is set to all employees in the center. To run the report for the turnaways of specific employees, select the name from the list. | |
Time | Select a time period for the report from the following options: Today, Last 7 days, Last 14 days, 1 month, 2 months, 3 months, 6 months, Custom. If you select Custom, select From and To dates for the report for a duration of up to six months. |
Column descriptions
Column | Description | |
|---|---|---|
Employee Code | Code assigned to the employee | |
Guest Name | Name of the guest associated with the turn away | |
Mobile Number | Shows the mobile number of the guest if it is entered | |
Date Requested | The date on which the guest wanted an appointment | |
Start Time | The time at which the guest wanted an appointment. | |
End Time | This is automatically calculated based on the start time and the total service time | |
Service | Name of the service requested by the guest. If the guest requests multiple services, including add-ons, all services appear comma-separated. | |
Service Price | The price of the service requested by the guest. If therapist specific pricing is applicable to the center, the report shows the service price specific to the requested therapist | |
Service Time | The service time of the requested service as configured in the system | |
Recovery Time | The recovery time of the requested service as configured in the system | |
Request | Shows if the guest has requested for a specific therapist or a specific gender for the therapist | |
Therapist | Shows the name of the therapist, if any, that the guest has specifically requested for. If the guest requests multiple therapists, all therapists appear comma-separated. | |
Reason | Shows all the reasons selected for the turnaway | |
Created On | The date on which the turnaway was created | |
Created By | The employee who created the turnaway | |
Last Modified On | The last date on which any edits were made to the turnway | |
Modified By | The employee who edited the turnaway the last time | |
Notes | Shows any notes that was entered for the turnaway |
Employee Tasks report
Employees (mostly, providers) can set up tasks for themselves (to further guest management) so as to keep track of all their action items. This goes a long way in ensuring the smooth running of your business. Tasks may also be auto-created such as say, when guests do not come in for their scheduled appointments or when guests cancel appointments. In both these cases, the task is for the provider to call such guests and schedule appointments at the next convenient date.
When to use this report?
View a quick summary of employee tasks to get an overview of their action items.
Check the high priority tasks and their Due Dates.
Glance over tasks that are in Open status and decide on the next steps.
View tasks of terminated employees - this way, you don't lose track of tasks of employees who were terminated. You can also reassign these tasks to other employees.
Important notes
Ensure that you turn on the Employee Tasks report from the organization level.
Ensure that you are at the center for which you want to run the report.
On the main menu, click the Reports tab.
On the Reports Dashboard, click Employee > Tasks. The report opens in a new tab.
Make your selections in the filter criteria and click Refresh Best Practice: To view all columns of the report, we recommend that you always export the report.
Use the Excel or CSV icons on the top right corner to export the report.
Filters
Criteria | Options | Description |
|---|---|---|
Task Owner Name | -All Owners -List of all employees who have the relevant permissions to view and create tasks | Select the name of one or more employees for whom you want to see the Tasks report. You may also select All Owners to view the report for all the task owners |
Task Source | - All Sources - Manual - No-Show - Cancellation | Specify if you want to view data for tasks created manually or for tasks created automatically for No-Shows and Cancellations. |
Status | - Any Status - Open - Closed | Specify whether you want to see tasks that are still pending (Open) or those that are Closed, or all tasks. |
Time Period | - This month - 2 months - 3 months - 6 months - Custom | NoteBased on your requirement, from the drop-down list, select either today, last 7 or 14 days, 1, 2, 3, or 6 months. You can alternatively choose Custom from the list and specify custom dates. : For custom dates, you can view data for a maximum date range of 6 months at a time. Example: If you wish to see data from January to August, first view data from January to June and then view data from July to August. |
Column descriptions
Column | Description |
|---|---|
Task Name | The name of the task. Example: Cancellation on Invoice# SGE536749 (auto-created tasks appear in this format) or Follow Up on Diet Plan (a manually created task). |
Descriptions | NoteShows the description of the task. : Appears only when you export the report to Excel. |
Task Owner | Shows the name of the employee who owns the task. |
Guest Name | Shows the name of the guest related to the task. |
Status | Shows the status of the task such as Open (if the task is still Pending or In Progress) or Closed (if the task is completed) |
Due Date | Shows the due date of the task. Ideally, the task must be completed by this date. Due date is the actual date of appointment (for No show, typically both, Due Date and Created On dates are the same, but for Cancellations, the Due Date and the Created On date could vary as guests can cancel any time before the appointment). |
Priority | Shows the priority of the task such as Low, Medium, High. For auto-created tasks, the priority is set to High by default. |
Task Source | Shows the source of the task - such as whether the task was created manually or whether the task was created automatically when guests miss out on scheduled appointments (No-Shows) or when guests cancel appointments (Cancellations). |
Center | Shows the name of the center where the task was created. |
Created By | NoteShows the name of the employee who created the task. If the task is auto-created based on No-Shows and Cancellations, the name of the provider associated with such an appointment appears in the Created By field. : Appears only when you export the report to Excel. |
Created On | NoteShows the date on which the task was created. This is the date on which the appointment was a no-show or was canceled. If the task is auto-created based on appointment No-Shows and Cancellations, the date on which the appointment was a no-show or was canceled is considered as the Created On date. : Appears only when you export the report to Excel. |
FAQ
Q. How do I identify auto-created tasks?
A: The task name has a clue in it. All auto-created tasks appear in the format ‘No Show/Cancellation <Invoice Number>’. Another clue is the name that appears in the Created By - for auto-created tasks it reads Zenoti; for other tasks it gives the provider name.
Q: When I create a task, what is the status and how can I change it as it progresses?
A: When you create a task, the status is Open. Currently, there are only two statues - Open and Closed.
Q: How do I close a task?
A: Move the task to Closed status after the task is completed.