Industry Benchmark Report
This article explains how to manage access to and view the Industry Benchmark report.
Overview
Understanding industry performance trends is crucial for businesses to make informed strategic decisions. A 10% growth may seem positive, but if the industry standard is 15%, it signals room for improvement. Without benchmarking insights, businesses risk missed opportunities and ineffective planning.
The Industry benchmark report in Zenoti provides key performance metrics tailored for Salon, Spa, and Medical Spa businesses, allowing decision-makers to compare their performance with industry standards.
Note
This feature is not enabled by default. Reach out to your CSM or Zenoti representative to enable this feature for your business.
Important
This feature is available only to salon, spa, and medical spa businesses in the U.S.
Prerequisites
The Manager and Owner roles have the permission to view the Industry Benchmark Report enabled by default.
Role permissions to view the Industry Benchmark Report
To grant a user permission to view the Industry benchmark report, follow these steps:
At the organization level, click the Configuration icon.
Navigate to Security > Security roles.
Select a role and click the Permissions tab.
Expand the Data & Insights section, and for Industry benchmark report, select the View checkbox.
Access the Industry Benchmark Report
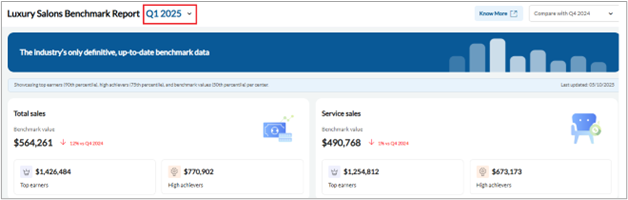
At the organization or center level, navigate to Data & insights > Industry benchmark report.
Select the quarter for which the report metrics must be displayed from the drop-down next to Similar Business Benchmark Report.
Note
'Industry' or ‘Similar Business’ is defined as businesses that belong to the same business type, sub-type, and average spend as your own business.
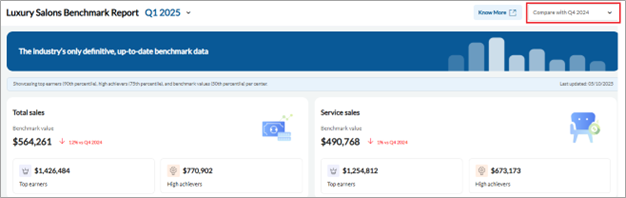
Select the quarter you want to compare from the drop-down list in the top-right corner.
Industry Benchmark Report metrics
Metric Categories
Name | Description |
|---|---|
Top earners | Top 10th percentile in the industry |
High achievers | Top 25th percentile in the industry |
Benchmark value | Industry average |
Metrics
Name | Description |
|---|---|
Total sales | Total sales by a center in a month, excluding tax. |
Service sales | Total service and day package sales by a center in a month. |
Product sales | Total product sales by a center in a month. |
Gift card sales | Total gift card sales by a center in a month. |
Average ticket size | Total sales (excluding tax) / total guest visits |
Membership sales | Total membership sales by a center in a month |
Online booking rate | Percentage of total bookings made through Webstore or CMA |
Package sales | Total package sales by a center in a month |
New guest visits | Number of visits by guests who do not have a prior visit on any previous day. |
Existing guest visits | Total number of visits by guests who have a prior visit. This is calculated as total visits minus new guest visits. |