Inventory reports
Product Expense Graph
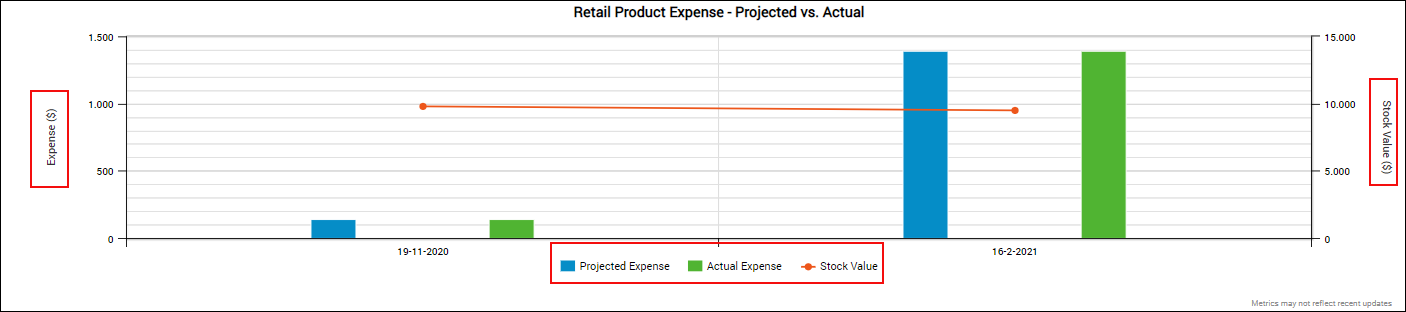
The Retail Product Expense-Expected vs. Actual graph gives you the amount spent to procure retail products by audit date for the current center.
Important
If you want to view the graph for more than five audits, use the Expenditure Report.
You can compare the actual expense incurred with the projected expense calculated by Zenoti.
When you navigate to the Inventory dashboard, you can see this graph for the most recent five audits done in the last six months for retail and consumables.
Retail
Consumable
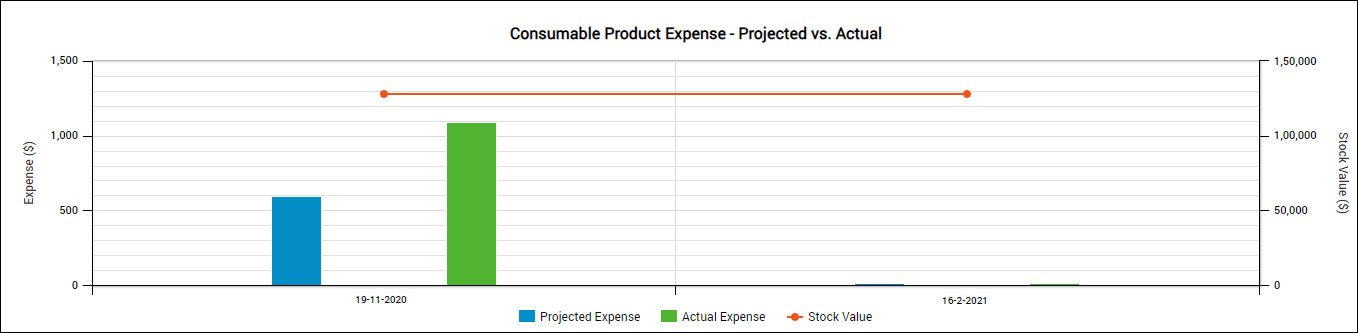
You can see the following details on the graph:
Projected Expense: The average cost over a period of time auto-calculated by Zenoti to purchase this product.
Projected Expense = Cost of (Outflow Sold quantity - Inflow POS Return + Outflow PO quantity + Outflow PO Return quantity + Outflow Consumed quantity)
Actual Expense: The average cost incurred to purchase this product.
Actual Expense = Cost of (Opening Qty + Inflow PO quantity + Inflow Transfer quantity – Outflow PO Return quantity + Inflow PO Return + Inflow Converted quantity - Outflow Converted quantity + (Inflow Bundle quantity + Inflow Unbundled quantity) – (Outflow Bundle quantity + Outflow Unbundled quantity) - Outflow - PO quantity - Outflow Transfer quantity - Outflow InTransit quantity – Closing Qty)
Stock Value: The value of the stock after the audit was reconciled at the current center.
Stock Value = Sum of Audited quantity x Sale price for the center
Click the color codes for various items, below the graph to remove or add the corresponding details to the graph.
For example, if you click the blue color code for Projected Expense, Zenoti does not consider projected expenses for the specified date range in the graphical report. However, when you click it again, the projected expenses are considered in the graphical report.
List of Audits reports
You can use the List of Audits report to view the audits that you have performed for the stock over a period of time at the current center. If you have the required permissions, you can also backdate audit and reconciliation and edit other details. The edits might be limited if your business has enabled the financial lock or edit lock.
Note
Note: First, try to enable this report for your organization. Refer to the Enable Specific Reports article for this. However, there is a chance that this report is not available for your organization. If so, you will not be able to see the report in the Reports > List of Reports section. If this is the case, reach out to your Zenoti representative to enable this report for you.
Follow these steps to run the report:
Select the center for which you want to run the report.
On the main menu, click the Reports tab.
On the Reports Dashboard, click Inventory.
From the filter, select Audit History.
Select the List of Audits report.
Select the filter criteria and click Refresh to see the report.
Note
To export to the report, click the Excel (
 ) or CSV (
 ) icons.
Filter criteria
Criteria | Options | Description |
|---|---|---|
Audit Date |
| Lists the time period during which the audit was performed. |
Product Type |
| TipLists the product types for which you can view the report. : If you wish to view the report for both retail and consumables, select All. |
Valuation Method |
| Lists the type of valuation methods that you can select to view the value of your audited stock. Average: Calculates the value of your stock by taking an average of unit cost for all products over a period of time. |
Column descriptions
Column | Description |
|---|---|
Audit Date | NoteThe date when the audit was performed. : You can click the audit date to view the audit details. If you have the required permissions to edit audit details, you can see the Edit option before the audit date. Read our Help article on how to edit an audit. |
Reconciled Date | NoteThe date when the audit was reconciled. : You can click the reconciliation date to view the audit details. If you have the required permissions to edit reconciliation details, you can see the Edit option before the reconciliation date. Read our Help article on how to edit reconciliation. |
Quantity Before Audit | The total quantity of the stock (store and floor) before the audit was performed. |
Value Before Audit | The total value of the stock (store and floor) before the audit was performed. |
Audited Quantity | The quantity of the stock (store and floor) after the audit. |
Value of Audited | The value of the stock after it is audited. You can also see the tax paid on procuring the stock. |
Reconciled Quantity | The quantity of the stock (store and floor) after the reconciliation. |
Value of Reconciled | The value of the stock after it is reconciled. You can also see the tax paid on procuring the stock. |
Here’s the list of frequently asked questions on this report:
Why I don’t see stock value in the report? The Hide Price permission is enabled for your role, which restricts you from viewing the stock value.
Why I don’t see the Edit option for the audit?
You will not see the Edit option due to one of the following reasons:
Your business has enabled the financial lock or edit lock, you cannot edit audit details once any of the two locks is applicable.
You do not have the EditPOLimitless permission enabled for your role.
You are backdating the audit to a date earlier than the last reconciliation date For example, if the audit date is 10th January 2020 and the last reconciliation was done on 5th Jan 2020, you can backdate the audit only until 6th Jan 2020.
Why I don’t see the Edit option for reconciliation?
You will not see the Edit option due to one of the following reasons:
Your business has enabled the financial lock or edit lock that does not allow you to edit reconciliation details once any of the two locks is applicable.
You do not have the Reconcile and EditPOLimitless permissions enabled for your role.
You are backdating the reconciliation to a date earlier than the last reconciliation date. For example, if the reconciliation date is 10th January 2020 and the last reconciliation was done on 5th Jan 2020, you can backdate the reconciliation only until 6th Jan 2020.
Why I don’t see the Audit date and Comments fields while I’m editing an audit? You do not have the Audit_Back_Date permission enabled for your role.
Edit an audit
Audit is the process of physically counting each product in the warehouse. By performing regular stock counts, you can identify pilferage and protect your inventory while ensuring that there are no stock-outs and spills.
If you are the inventory manager for your center, you come across situations where you might have submitted an incomplete/incorrect audit, selected the wrong center for audit, or missed counting a few products.
To handle such situations, based on role permissions, Zenoti allows you to edit an audit and change details such as audit date and stock quantity.
Note
You cannot delete an audit after it is submitted.
Moreover, if you do not have the permission to edit an audit and you want to edit the audited stock quantities, you can ask your manager to adjust the quantities during reconciliation.
Important
After you edit an audit, you must submit it for reconciliation, which is similar to the way you do a usual audit-reconciliation. Also, after you re-submit an audit for reconciliation, you are not allowed to do another audit (for the same product type) unless the edits are reconciled.
If your business has enabled the financial lock to control edits to financial transactions beyond a set time period, or Zenoti has enabled the edit lock (90 days restriction) for your business, irrespective of the role permissions, you cannot edit audit details beyond the allowed period.
At the center level, click the Reports icon.
Navigate to Inventory > Audit History.
Select the List of Audits report.
Generate the report with the desired criteria.

Click Edit for the audit you want to edit.
Note
The edits might be limited if you do not have the Edit permission or Audit_ Back_Date permission enabled for your role. Also, you cannot edit an audit if your business has enabled the financial lock or the edit lock.
The edit window appears.

Enter the desired audit date in the Audit date box.
Important
You can edit the audit date until the last audit date not beyond that.
Enter any notes in the Comments box that you want your manager to consider while reconciling the audit.
Note
If you do not have the Audit_Back_Date permission, you will not see the Audit date and Comments boxes.
Click Save.
If you missed entering the stock count for a product or you entered the stock count incorrectly, you can make the necessary changes.
If you want to save the changes and not submit the audit with the changes, click Save Changes.
Click Submit Audit to submit the audit for reconciliation.
Similar to an audit that you do normally by navigating to Inventory > Audit, when you edit an audit and resubmit it, you must edit the reconciliation on the Audit History report.
Edit a reconciliation
Reconciliation is the process of comparing the expected inventory and the actual inventory. It provides the manager with data to follow up with staff and act on discrepancies. After the Inventory Manager submits the stock count data to you, you must reconcile it.
After you reconcile an audit, you might sometimes need to edit the reconciliation. Let’s say that you reconciled an audit you received stock at your center,
Important
After you edit a reconciliation, and your business has enabled approvals for reconciliations with unaccounted stock quantities more than the threshold limit, the reconciliation is automatically sent for approval. Also, when the reconciliation is sent for approval, the inventory manager is not allowed to do another audit unless the reconciliation is approved.
Based on your role permission, Zenoti allows you to edit a reconciliation.
Ensure you are the center for which you want to edit a reconciliation.
On the main menu, click the Reports icon.
Navigate to Inventory > Audit History.
Select the report List of Audits.
Generate the report with the desired criteria.

Click Edit for the reconciliation you want to edit.
Note
The edits might be limited if you do not have the Edit permission your role or your business has enabled the financial lock or edit lock.
The edit window appears.

Enter the desired reconciliation date in the Reconcile date box.
Important
You can edit the audit date until the last audit date not beyond that.
Enter any notes in the Comments box that you want to make to keep for records.
Click Save.
If you want to edit the stock counts, you can make the necessary changes.
If you want to save the changes and not submit the changes right away, click Save Changes.
Click Update Reconcile to update the reconciliation. If your business has enabled approval for reconciliations with unaccounted stock quantities more than the threshold limit, the reconciliation is automatically sent for approval.
Similar to a reconciliation that you normally do by navigating to Inventory > Reconcile, when you edit a reconciliation and if your business has enabled approval, you must wait until the reconciliation is approved.
List of Audits by Products report
You can use the List of Audits by Products report to view the audits that are performed for a specific product or for a group of products in a category over a period of time at the current center.
Note
Note: First, try to enable this report for your organization. Refer to the Enable Specific Reports article for this. However, there is a chance that this report is not available for your organization. If so, you will not be able to see the report in the Reports > List of Reports section. If this is the case, reach out to your Zenoti representative to enable this report for you.
Note
If you want to edit audit or reconciliation details, you can use the List of Audits report.
Follow these steps to run the report:
Select the center for which you want to run the report.
On the main menu, click the Reports tab.
On the Reports Dashboard, click Inventory.
From the filter, select Audit History.
Select the List of Audits by Products report.
Select the filter criteria and click Refresh to see the report.
Note
To export to the report, click the Excel (
) or CSV () icons.
Filters
Criteria | Options | Description |
|---|---|---|
Audit Date |
| Lists the time period during which the audit was performed. |
Product Type |
| Lists the product types for which you can view the report. TipIf you wish to view the report for both retail and consumables, select All. |
Valuation Method |
| Lists the type of valuation methods that you can select to view the value of your audited stock.
|
Category | List of product categories | Lists all the product categories. You can select a category to view the audits that you have done for a specific category of products. |
Subcategory | List of product subcategories based on each category | Lists all the product subcategories within the main category. You can select a subcategory to view the audits that you have done for a specific subcategory of products. |
Product Name, Product Code, or Product Barcode | Allows you to search for a product by its name or code. You can also enter the product’s barcode. |
Column descriptions
Column | Description |
|---|---|
Code | A unique identifier assigned to the product. |
Name | The name of the product. For example, Anti-wrinkle cream. NoteClick the product name to view the product’s transaction history. |
Unit | The unit of measurement of the product. For example, ml, gallon, oz, grams can be the units of measurement |
Category | The category to which the product belongs. For example, in Zenoti your business may have a category such as Hair Care. |
Subcategory | The subcategory to which the product belongs. For example, in Zenoti your business may have a subcategory such as Hair Styling for the category, Hair Care. |
Vendor | The name of the vendor with which the product is associated. NoteYou will see Multiple in this column if the product is associated with multiple vendors. |
Audited Date | The date when the stock was audited. NoteYou can click this date to view the complete audit details. |
Reconciled Date | The date when the audit was reconciled. NoteYou can click this date to view the complete reconciliation details. |
Quantity Before Audit | The total quantity of the product (store and floor) before the audit was performed. |
Value Before Audit | The total value of the product (store and floor) before the audit was performed. |
Audited Quantity | The total quantity of the product (store and floor) after the audit was performed. If there is a difference between the quantity before the audit and the quantity after the audit, it means that there is stock shrinkage or pilferage. To know the exact reason, click the audit date. |
Value of Audited | The total value of the product (store and floor) after the audit was performed. |
Reconciled Quantity | The total quantity of the product (store and floor) after the audit was reconciled. |
Value of Reconciled | The total value of the product (store and floor) after the audit was reconciled. |
Projected Value | The stock value calculated by Zenoti from the last audit to the current audit, based on the following outflow transactions: Retail
Consumable
|
Actual Value | The stock value calculated by Zenoti from the last audit to the current audit, based on the actual usage of the stock. |
Audit Type | The type of audit that was conducted. It can be either one of the following options:
|
Reconcile Type | The type of reconciliation that was done. It can be either one of the following options:
|
Returns report
You can use the Returns report to know about the products that are returned by guests or the products that you have returned to the vendor.
Note
You can also view this report for a specific product by entering the product name while generating the report.
Note
Note: First, try to enable this report for your organization. Refer to the Enable Specific Reports article for this. However, there is a chance that this report is not available for your organization. If so, you will not be able to see the report in the Reports > List of Reports section. If this is the case, reach out to your Zenoti representative to enable this report for you.
Follow these steps to run the report:
Select the center.
On the main menu, click the Reports tab.
On the dashboard, click Inventory > Returns (from the filter).
From the list of reports, select Returns. The Product Returns page appears.
Select the filter criteria and click Refresh . Notes: -
Note
To export the report, click the Excel (
) or CSV () icons.To view the report in full-screen, click

Filters
Criteria | Options | Description |
Return Type |
| The type of returns for which you want to view the report.
|
Return Date |
| The date or date range for which you want to view the report. To select a data range, select Custom. NoteFor custom dates, you can view data for a maximum date range of 6 months at a time. For example, if you wish to see data from January to August, first view data from January to June and then view data from July to August. |
Product Name | The specific product for which you want to view the report. |
Column descriptions
Column | Description |
Return Date | The date on which the product was returned. |
Name | The name of the product. NoteClick the product name to view the product history. |
Invoice No. | The invoice number generated when the guest returned the product. You can click the invoice number to view the invoice. NoteYou will see this column when you generate the report for Customer Returns. |
Base Invoice No. | The invoice number generated when the guest purchased the product. You can click the invoice number to view the invoice. NoteYou will see this column when you generate the report for Customer Returns. |
Guest | The name of the guest on the purchase invoice. You can click the guest’s name to view the guest profile. NoteYou will see this column when you generate the report for Customer Returns. |
PO Number | The return order number (Ref#) on which the product was returned to the vendor. NoteYou will see this column when you generate the report for Vendor Returns. |
Vendor | The vendor to which the product is associated. If the product is associated with multiple vendors, you will see Multiple in this column. NoteYou will see this column if it is enabled for your business and you have generates the report for Vendor Returns. |
Restocked Quantity | The quantity of the product that the front-desk staff had restocked to the store. NoteYou will see this column only if your business has enabled the Allow to restock returned products setting at the org level. |
Restocked Value | The value of the restocked product. NoteYou will see this column only if your business has enabled the Allow to restock returned products setting at the org level. |
Discarded Quantity | The quantity of the product that the front-desk staff had discarded. One reason for discarding a product can be that the customer has already used some quantity of the product or the product is expired. NoteYou will see this column only if your business has enabled the Allow to restock returned products setting at the org level. |
Discarded Value | The value of the discarded stock. NoteYou will see this column only if your business has enabled the Allow to restock returned products setting at the org level. |
Return Type | Indicates who returned the product. You will see either of the two following values in this column:
NoteYou will see this column when you generate the report for All types of product returns. |
Quantity | The quantity of the product returned. |
Value | The value of the returned product. |
Tax Value | The tax that is zeroed out due to the product return. |
Value report
You can use the Value report to view the value of stock for the current date or a past date. You can choose to calculate the value of your stock using the perpetual average cost method. In addition to the value, you can also view the quantity of each product in stock and the tax paid on it.
Note
Note: First, try to enable this report for your organization. Refer to the Enable Specific Reports article for this. However, there is a chance that this report is not available for your organization. If so, you will not be able to see the report in the Reports > List of Reports section. If this is the case, reach out to your Zenoti representative to enable this report for you.
Tip
Read our FAQ article to know about some of the frequently asked questions on the Value report.
Follow these steps to run the report:
Select the center.
On the main menu, click the Reports tab.
On the dashboard, click Inventory > Value (from the filter).
From the list of reports, select Value.
The Inventory Value Report page appears.
Select the filter criteria and click Refresh.
Note
To export the report, click the Excel (
) or CSV () icons.To view the report in full-screen, click
Filters
Criteria | Options | Description |
Report Type |
| Select the type of products for which you want to view the report. Select All if you want to view the report for both retail and professional supplies (consumables). |
Business Unit | List of business units | Select the desired business unit. Select All if you want to view the value of stock across all business units. Example: Hair Treatment, and Skin Care, Hand Care. |
Category | List of product categories | Select the category to which the product belongs. For example, in Zenoti your business may have a category such as Hair Care. |
Vendor If you do not see this filter, reach out to Zenoti to enable it for your business | List of vendors for the current center | Select the desired vendor to view the stock value of products that are associated with this vendor. |
Valuation Method |
| Select the way you want Zenoti to calculate the value of the stock. |
Time Period | Data range | Select the time period for which you want to view the report. |
Product Name, Product Code, or Product Barcode | You can use this search box to search for a product by its name, code, or barcode. |
Column descriptions
Column | Description |
Code | The code that uniquely identifies the product. |
Name | The name of the product. |
Unit | The unit of measurement of the product. For example, ml, gallon, oz, grams can be the unit of measurements. |
Category | The category to which the product belongs. For example, in Zenoti your business may have a category such as Hair Care.. |
Subcategory | The subcategory to which the product belongs. For example, in Zenoti your business may have a sub-category such as Hair Styling for the category, Hair Care. |
Vendor If you do not see this column, reach out to Zenoti to enable it for your business. | The name of the vendor with which the product is associated. |
Qty | The total quantity of the product (both store and floor). |
Store |
|
Floor |
|
On-Hand Qty | The total quantity of the product. NoteYou will see this column only if you’ve signed up with Zenoti after April 2020 release – you will not see the Qty, Store, and Floor columns. |
Note
You can view the total value of your stock and the tax paid to procure the stock at the end of the report.
Product Consumption report
This report shows the details about the inflow and outflow details of stock at a center. The report shows the consumption that was projected by Zenoti and also the actual consumption that was made at the current center.
Note
Note: First, try to enable this report for your organization. Refer to the Enable Specific Reports article for this. However, there is a chance that this report is not available for your organization. If so, you will not be able to see the report in the Reports > List of Reports section. If this is the case, reach out to your Zenoti representative to enable this report for you.
Follow these steps to run the report:
At the center level, click the Reports icon.
On the Reports dashboard, click Inventory > Consumption.
The report appears.
Select the filter criteria and click Refresh to see the report.
Note
To export the report, click the Excel or CSV options.
Unable to generate the report??
Filters
Criteria | Options | Description |
Product Type |
| Lets you view the report based on the type of product. |
Category | List of all product categories | Lets you view the report based on a product category. |
Subcategory | List of all product subcategories | Lets you view the report based on a product category within the main category. |
Consumption Date |
| Lets you select the period for which you want to view the report. To select a date range, select Custom. NoteFor custom dates, you can view data for a maximum date range of 6 months at a time. For example, if you wish to see data from January to August, first view data from January to June and then view data from July to August. |
Product Name, Code, Barcode | Lets you generate the report for a specific product by its name or code. You can also scan the product barcode. |
Column descriptions
Column | Description | Additional Information |
Code | A unique code that identifies the product. | |
Name | The name of the product. NoteClick the product name to view the product history. | |
Unit | The way you measure the product's quantity. | For example, ml, gallon, oz, grams can be the unit of measurement. |
Category | The category to which this product belongs. | For example, in Zenoti your business may have a category such as Hair Care. |
Subcategory | The subcategory to which this product belongs. | For example, in Zenoti your business may have a subcategory such as Hair Styling for the category, Hair Care. |
Vendor | The vendor to which this product is associated. NoteIf a product is associated with multiple vendors, you will see Multiple in this column. | |
Opening Qty - Store | The quantity of this product in store on the report start date. NoteYou will not see this column if your business follows the On-Hand quantity model. | For example, if the report is generated on Jan 1st, for a duration of one month, the report start date is Jan 1st and the report end date is Feb 1st. For this duration, the Opening Qty-Store column will display the quantity of the product on store as on Jan 1st. |
Opening Qty - Floor | The quantity of this product on the floor on the report start date. NoteYou will not see this column if your business follows the On-Hand quantity model. | For example, if the report is generated on Jan 1st, for a duration of one month, the report start date is Jan 1st and the report end date is Feb 1st. For this duration, the Opening Qty-Store column will display the quantity of the product on floor as on Jan 1st. |
Opening On-Hand Qty | The quantity of this product on the report start date. NoteYou will see this column only if your business follows the On-Hand quantity model. | For example, if the report is generated on Jan 1st, for a duration of one month, the report start date is Jan 1st and the report end date is Feb 1st. For this duration, the Opening Qty column will display the quantity of the product on Jan 1st. |
Opening Value | The value of this product on both store and floor (on-hand) on the report start date. | For example, if the report is generated on Jan 1st, for a duration of one month, the report start date is Jan 1st and the report end date is Feb 1st. For this duration, the Opening Qty-Store column will display the quantity of the product on store and floor as on Jan 1st. |
Inflow - PO quantity | The quantity of this product from the purchase orders delivered at the current center. | |
Inflow - Value | The value of this product from the purchase orders delivered at the current center. | |
Inflow - Transfer quantity | The quantity of this product that is delivered at the center from transfer orders. | |
Inflow - Value | The value of this product from the transfer orders delivered at the current center. | |
Inflow - Converted quantity | The quantity of this product from the conversion process. NoteIn case you’ve selected All as the product type while generating the report, you will see 0 in this column. |
|
Inflow - Value | The value of this product from the conversion process. NoteIn case you’ve selected All as the product type while generating the report, you will not see any number in this column. |
|
Inflow - Bundle quantity | The quantity of the product kit (bundle) after it is bundled on the Product Kit Management page. | |
Inflow - Value | The value of the product kit (bundle) after it is bundled on the Product Kit Management page. | |
Inflow - Unbundled quantity | The quantity of this individual product that is increased after product kits, containing this product, are unbundled on the Product Kit Management page. NoteFor product kits, you will see 0 in this column. | For example, if a product kit, Hair Care Kit, consists of two products, Hair Shampoo (quantity 2) and Hair Conditioner (quantity 1), when the kit is unbundled for quantity 5, the values in this column are as follows: Hair Care Kit - 0 Hair Shampoo - 2x5 = 10 Hair Conditioner - 1x5 = 5 |
Inflow - Value | The value of this product that is increased after product kits containing this product are unbundled on the Product Kit Management page. NoteFor product kits, you will see 0 in this column. | |
Inflow - PO Return | The quantity of this product returned from other centers to the current center that is acting as a vendor. NoteFor centers that are not acting as vendors, you will see 0 in this column. | |
Inflow - Value | The value of this product due to returns from other centers to the current center (acting as a vendor). NoteFor centers that are not acting as vendors, you will see zero in this column. | |
Inflow - POS Return | The quantity of this product that is returned and restocked through POS. NoteThis number does not include the discarded quantity of this product from POS returns. | |
Inflow - Value | The value of this product because of returns from POS NoteThis number does not include the value of the discarded quantity of this product from POS returns. | |
Checkout - Qty | The quantity of this product that is checked out from store to floor. NoteIf your business follows the On-Hand quantity model, you will not see this column. | |
Checkout - Value | The value of this product from store-to-floor check-outs. NoteIf your business follows the On-Hand quantity model, you will not see this column. | |
Outflow - PO quantity | The quantity of this product that is delivered from the current center (acting as a vendor) to other centers through purchase orders. | |
Outflow - Value | The value of this product from purchase orders delivered from the current center (acting as a vendor) to other centers. | |
Outflow - Transfer quantity | The quantity of this product that is delivered from the current center to other centers through transfer orders. | |
Outflow - Value | The value of this product from transfer orders delivered from the current center to other centers. | |
Outflow - Bundle quantity | The quantity of this individual product that is used when a kit containing this product is bundled on the Product Kit Management page. NoteFor product kits, you will see 0 in this column. | For example, if a product kit, Hair Care Kit, consists of two products, Hair Shampoo (quantity 2) and Hair Conditioner (quantity 1), when the kit is bundled for quantity 5, the values in this column as follows: Hair Care Kit - 0 Hair Shampoo - 2x5 = 10 Hair Conditioner - 1x5 = 5 |
Outflow - Value | The value of this individual product that is used when a kit containing this product is bundled on the Product Kit Management page. | |
Outflow - Unbundled quantity | The quantity of this product kit that is decreased after the unbundling process on the Product Kit Management page. NoteFor products, you will see 0 in this column. | For example, if a product kit, Hair Care Kit, consists of two products, Hair Shampoo (quantity 2) and Hair Conditioner (quantity 1), when the kit is unbundled for quantity 5, the values in this column as follows: Hair Care Kit = 5 Hair Shampoo = 0 Hair Conditioner = 0 |
Outflow - Value | The value of this product kit that is decreased after the unbundling process on the Product Kit Management page. NoteFor products, you will see 0 in this column. | |
Outflow - Sold quantity | The quantity of this product that is sold from POS. NoteFor consumables, you will see 0 in this column. | |
Outflow - Value | The value of this product that is sold from POS. NoteFor consumables, you will see 0 in this column. | |
Outflow - Consumed quantity | The quantity of this product consumed in services. This is the bill of material associated with services. NoteFor retail, you will see 0 in this column. | |
Outflow - Value | The value of this product in BOM (Bill of Material) consumption. NoteFor retail, you will see 0 in this column. | |
Outflow - Converted quantity | The quantity of this product used in the conversion process. NoteIn case you’ve selected All as the product type while generating the report, you will see 0 in this column. |
|
Outflow - Value | The value of this product due to the conversion process. NoteIn case you’ve selected All as the product type while generating the report, you will not see any number in this column. |
|
Outflow - In Transit quantity | The quantity of this product that is dispatched from the current center to the destination center, but not yet delivered. | |
Outflow - Value | The value of this product that is dispatched from the current center to the destination center, but not yet delivered. | |
Outflow - PO Return quantity | The quantity of this product that is returned from the current center to vendors. This number also includes the stock that is returned to any other center that is acting as a vendor. | |
Outflow - Value | The value of this product that is returned from the current center to vendors. This number also includes the stock that is returned to any other center that is acting as a vendor. | |
Closing Qty | The on-hand quantity of this product as on the report end date. NoteIf your business follows the store and floor model, you can see separate columns for store and floor. | |
Closing Value | The value of this product on both store and floor (on-hand) on the report end date. | |
Actual Used-Qty | The total quantity of this product that was used in various transactions within Zenoti. It is calculated as, Actual Used Qty = Opening Qty + Inflow PO quantity + Inflow Transfer quantity – Outflow PO Return quantity + Inflow PO Return + Inflow Converted quantity - Outflow Converted quantity + (Inflow Bundle quantity + Inflow Unbundled quantity) – (Outflow Bundle quantity + Outflow Unbundled quantity) - Outflow - PO quantity - Outflow Transfer quantity - Outflow In Transit quantity – Closing Qty | |
Actual Used-Value | The total value of this product that was used in various inventory transactions within Zenoti. | |
Projected Used-Qty | The total quantity of this product that was expected to be used in various transactions within Zenoti. It is calculated as, Projected Qty = Outflow Sold quantity-Inflow POS Return + Outflow PO quantity + Outflow PO Return quantity + Outflow Consumed quantity | |
Projected Used-Value | The total value of this product that was expected to be used in various transactions within Zenoti. NoteThis number is projected by Zenoti and may not match with the actual value that was used. | |
No. of Audits | The number of times this product is audited (auto and manual) during the report start date and end date. | |
Unaccounted | The difference in quantity between projections made by Zenoti for this product and its actual stock during audits. | |
Manual Checkouts | The quantity of this product that was manually checked out from the Check Out page in Zenoti. |
Why I don't see a product's value?
This might be due to one of the following reasons:
You have not raised any order for the product.
The value of a product (retail or consumables) comes from the unit price at which they are brought into the center using a purchase order or transfer order.Create and raise a purchase orders to get the value for your stock.
Note
You can use the import option to get multiple purchase orders in the system.
In this case, you will see the Value and the Tax Paid columns, but with zeroes.
The Hide Price permission is enabled for your role.
In this case, you will not see the Value and Tax Paid columns in the Value report and any other report or page in the Inventory where these columns exist.
Taxes - Transfer Tax Details report
You can use the Taxes - Transfer Tax Details report to view the tax paid by the current center to receive products from another center that is in a different state or region.
Note
Note: First, try to enable this report for your organization. Refer to the Enable Specific Reports article for this. However, there is a chance that this report is not available for your organization. If so, you will not be able to see the report in the Reports > List of Reports section. If this is the case, reach out to your Zenoti representative to enable this report for you.
To run the report, follow these steps:
Select the center.
On the main menu, go to the Reports tab.
On the dashboard, click Inventory > Taxes (from the filter). The Inventory Tax Reports page appears.
From the list of reports, click Transfer Tax Details. The report opens in a new tab.
Select the filter criteria and click Refresh. Note:
Note
To export the report, click the Excel (
) or CSV () icons.
Filters
Criteria | Options | Description |
Report Name |
| Lists all the tax reports for inventory.
|
Center Name |
| Lists the center name for which you want to run the report. NoteAt the Organization level, you can view this report for any center. |
Product Type |
| Lists the type of products: retail, consumable, or both. TipSelect All if you want to view the report for both retail and professional supplies (consumables). |
Delivery Date |
| Lists the date range during which the products were delivered. This can be the partial delivery date or the full delivery date. To select a date range, select Custom. NoteFor custom dates, you can view data for a maximum date range of 6 months at a time. For example, if you wish to see data from January to August, first view data from January to June and then view data from July to August. |
Search | Name, Code, Barcode | Lets you filter the report for a particular product. If you have selected a category and sub-category, the product you are searching for must fall under the select sub-category. If you are not sure of the category and sub-category, select All for both those filters. TipIf you want to view the sales of all the products at the current center, leave this field blank. |
Column descriptions
Column | Description |
Ref Num | The transfer order reference number. It is generated by Zenoti when the order is created. |
To | The name of the center where the order is delivered. NoteIf the report is viewed at the center level, this column is always the current center name. |
Delivered Date | The date and timestamp when the products are delivered to the current center. NoteEven for a partial shipment, a delivery date is recorded. |
Invoice-No | The invoice number generated by the vendor on each product delivery. |
From | The name of the source center from where the order is received at the current center. |
TIN# | The Tax Payer Identification Number (TIN) of the current center. NoteIf your business is based out of the US, this is the Federal Taxpayer Identification. |
GSTIN | A number generated by Zenoti for a tax invoice issued towards the purchase of product by the guest. NoteYou will see this column only if you have GST enabled for your organization. |
Product | The name of the product. |
HSN | The code that classifies the product under GST. NoteThis is only applicable for businesses that have GST enabled. |
Tax Group | The tax group defined for inventory at the product level. |
Tax Percentage | The percentage of tax as defined in the tax group. |
Qty Delivered | The total quantity of products delivered at the current center. |
Cost | The unit price of the product. |
Tax Component | The tax component defined in the product. NoteYou may see more than one tax component based on the tax definition. |
Tax Amount | The total amount of tax paid by the current center to transfer the product. |
Total | The total amount paid by the current center to transfer the product. It is calculated as: Total = (Cost x Qty Delivered) +Tax Amount |
List of Audits reports
You can use the List of Audits report to view the audits that you have performed for the stock over a period of time at the current center. If you have the required permissions, you can also backdate audit and reconciliation and edit other details. The edits might be limited if your business has enabled the financial lock or edit lock.
Note
Note: First, try to enable this report for your organization. Refer to the Enable Specific Reports article for this. However, there is a chance that this report is not available for your organization. If so, you will not be able to see the report in the Reports > List of Reports section. If this is the case, reach out to your Zenoti representative to enable this report for you.
Follow these steps to run the report:
Select the center for which you want to run the report.
On the main menu, click the Reports tab.
On the Reports Dashboard, click Inventory.
From the filter, select Audit History.
Select the List of Audits report.
Select the filter criteria and click Refresh to see the report.
Note
To export to the report, click the Excel (
) or CSV () icons.
Filter criteria
Criteria | Options | Description |
|---|---|---|
Audit Date |
| Lists the time period during which the audit was performed. |
Product Type |
| TipLists the product types for which you can view the report. : If you wish to view the report for both retail and consumables, select All. |
Valuation Method |
| Lists the type of valuation methods that you can select to view the value of your audited stock. Average: Calculates the value of your stock by taking an average of unit cost for all products over a period of time. |
Column descriptions
Column | Description |
|---|---|
Audit Date | NoteThe date when the audit was performed. : You can click the audit date to view the audit details. If you have the required permissions to edit audit details, you can see the Edit option before the audit date. Read our Help article on how to edit an audit. |
Reconciled Date | NoteThe date when the audit was reconciled. : You can click the reconciliation date to view the audit details. If you have the required permissions to edit reconciliation details, you can see the Edit option before the reconciliation date. Read our Help article on how to edit reconciliation. |
Quantity Before Audit | The total quantity of the stock (store and floor) before the audit was performed. |
Value Before Audit | The total value of the stock (store and floor) before the audit was performed. |
Audited Quantity | The quantity of the stock (store and floor) after the audit. |
Value of Audited | The value of the stock after it is audited. You can also see the tax paid on procuring the stock. |
Reconciled Quantity | The quantity of the stock (store and floor) after the reconciliation. |
Value of Reconciled | The value of the stock after it is reconciled. You can also see the tax paid on procuring the stock. |
Here’s the list of frequently asked questions on this report:
Why I don’t see stock value in the report? The Hide Price permission is enabled for your role, which restricts you from viewing the stock value.
Why I don’t see the Edit option for the audit?
You will not see the Edit option due to one of the following reasons:
Your business has enabled the financial lock or edit lock, you cannot edit audit details once any of the two locks is applicable.
You do not have the EditPOLimitless permission enabled for your role.
You are backdating the audit to a date earlier than the last reconciliation date For example, if the audit date is 10th January 2020 and the last reconciliation was done on 5th Jan 2020, you can backdate the audit only until 6th Jan 2020.
Why I don’t see the Edit option for reconciliation?
You will not see the Edit option due to one of the following reasons:
Your business has enabled the financial lock or edit lock that does not allow you to edit reconciliation details once any of the two locks is applicable.
You do not have the Reconcile and EditPOLimitless permissions enabled for your role.
You are backdating the reconciliation to a date earlier than the last reconciliation date. For example, if the reconciliation date is 10th January 2020 and the last reconciliation was done on 5th Jan 2020, you can backdate the reconciliation only until 6th Jan 2020.
Why I don’t see the Audit date and Comments fields while I’m editing an audit? You do not have the Audit_Back_Date permission enabled for your role.
List of Orders by Products report
The List of Orders by Products report provides you details of all the purchase orders for the current center by a product or vendor over a period of time.
Note
Note: First, try to enable this report for your organization. Refer to the Enable Specific Reports article for this. However, there is a chance that this report is not available for your organization. If so, you will not be able to see the report in the Reports > List of Reports section. If this is the case, reach out to your Zenoti representative to enable this report for you.
To run the report, follow these steps:
Select the center.
On the main menu, click the Inventory tab.
On the left-hand side menu, click Procurement>Orders. The Manage Purchase Orders & Transfers page appears.
Select List of Orders by Products.
Select the filter criteria and click Refresh.
The report appears.
Note
To export the report, click the Excel (
) or CSV () icons.
Filters
Criteria | Options | Description |
Order Type |
| Lists the type of orders.
|
| Lists various order statuses.
| |
Product Type |
| Lists the type of products. :consumables. NoteSelect All to view the report for both, retail and |
Category | List of product categories | Lists all product categories. For example, in Zenoti your business may have a category such as Hair Care. |
Subcategory | List of subcategories | Lists all product subcategories in the selected category. For example, in Zenoti your business may have a subcategory such as Hair Styling for the category, Hair Care. |
Order Date |
| Lists the date range during which the order was created.
|
Note
After you generate the report, use the Search box to search for a specific order by its Ref# (order number) or by notes that were provided on the entire order.
Column descriptions
Column | Description |
Ref# | A unique code that identifies the order. NoteClick the reference number to view the order details. |
Product Code | A unique code that identifies the product. |
Vendor Product Part Number | A unique code assigned to the product by the vendor. |
Product Name | The name of the product. For example, Anti-wrinkle cream. NoteClick the product name to view the product details. |
Category | The category to which the product belongs. For example, in Zenoti your business may have a category such as Hair Care. |
Subcategory | The subcategory to which the product belongs. For example, in Zenoti your business may have a subcategory such as Hair Styling for the category, Hair Care. |
Vendor | The name of the vendor to which the product is associated. NoteYou will see Multiple in this column in case the product is associated with multiple vendors. |
Order On | The date on which the order was created. |
Deliver On | The date on which stock was delivered at the current center. NoteFor partial deliveries/shipments, this date is the partial delivery date. |
To | The name of the current center. |
From | The name of the vendor (for purchase orders) or the source center (for transfer orders) from where stock is received at the current center. |
Status | The status of the order. |
Invoice | The invoice number entered in the purchase order/transfer order. |
Is Paid | Indicates if this invoice is paid for the order, with a Yes or No. You will see Yes in this column if the Is Paid checkbox was selected in the order. |
Ordered-Retail Qty | The quantity of the product that is ordered/requested for retail. |
Ordered-Cosumable Qty | The quantity of the product that is ordered/requested for service consumption. |
Ordered-Total Qty | The total quantity of the product that is ordered/requested for both retail and consumable. It is calculated as: Ordered-Total Qty = Ordered-Retail Qty + Ordered-Cosumable Qty |
Ordered-Total Value | The total value of the product (retail and consumable) from the order. |
Ordered-Total Tax | The total tax charged to purchase the product. |
Delivered-Retail Qty | The quantity of the retail product that is delivered to the current center. |
Delivered-Cosumable Qty | The quantity of the consumable product that is delivered to the current center. |
Delivered-Total Qty | The total quantity of the product that that is delivered to the current center. It is calculated as: Delivered-Total Qty = Delivered-Retail Qty + Delivered-Cosumable Qty |
Delivered-Total Value | The total cost of the delivered stock (retail and consumable). |
Delivered-Total Tax | The total tax charged to purchase the stock (retail and consumable). |
Notes | Any additional information or comments given by the inventory manager for the product in a specific order. |
List of Orders by Partials report
The List of Orders by Partials report provides you a list of all orders that are partially delivered to the current center.
Note
Note: First, try to enable this report for your organization. Refer to the Enable Specific Reports article for this. However, there is a chance that this report is not available for your organization. If so, you will not be able to see the report in the Reports > List of Reports section. If this is the case, reach out to your Zenoti representative to enable this report for you.
To run the report, follow these steps:
Select the center.
On the main menu, click the Inventory tab.
On the left-hand side menu, click Procurement>Orders.
The Manage Purchase Orders & Transfers page appears.
Select List of Orders by Partials.
Select the filter criteria and click Refresh.
The report appears.
Note
To export the report, click the Excel (
) or CSV () icons.
Filters
Criteria | Options | Description |
Order Date |
| Lists the date range during which the order was created.
|
Column descriptions
Column | Description |
Ref# | A unique code that identifies the order. NoteClick the reference number to view the order details. |
Order On | The date on which the order was created. |
Deliver On | The date on which stock was delivered at the current center. NoteFor partial deliveries/shipments, this date is the partial delivery date. |
To | The name of the current center. |
From | The name of the vendor (for purchase orders) or the source center (for transfer orders) from where stock is received at the current center. |
Status | The status of the order – in this case, the status shows Partially Delivered. |
Qty | The total quantity of the products received as part of the order. |
Value | The total cost of the products after receiving them at the current center. |
Tax | The total tax paid by the current center on delivery. |
Notes | Any additional information or comments given by the inventory manager for the entire order. NoteThis is not the note given for a specific product. |
List of Orders report
The List of Orders report provides you details of all the orders: purchase, transfer, and return, for the current center.
To run the report, follow these steps:
Select the center.
On the main menu, click the Inventory tab.
On the left-hand side menu, click Procurement>Orders. The Manage Purchase Orders & Transfers page appears.
Select List of Orders.
Select the filter criteria and click Refresh. The report appears.
Note
To export the report, click the Excel (
) or CSV () icons.
Filters
Criteria | Options | Description |
Order Type |
| Lists the type of orders.
|
Vendor NoteIf you do not see this filter, reach out to Zenoti to enable it for your business. | List of all vendors for the current center. | Lists all vendors associated with the current center. NoteFor franchisees, the warehouse or corporate office acts as a vendor. In this case, you will see the warehouse center name on the Vendor list. |
| Lists various order statuses.
| |
Order Date |
| Lists the date range during which the order was created.
|
Note
After you generate the report, use the Search box to search for a specific order by its Ref# (order number) or by notes that were provided on the entire order.
Column descriptions
Column | Description |
Ref# | A unique code that identifies the order. NoteClick the reference number to view the order details. |
Order On | The date on which the order was created. |
Deliver On | The date on which stock was delivered at the current center. NoteFor partial deliveries/shipments, this date is the partial delivery date. |
To | The name of the current center. |
From | The name of the vendor (for purchase orders) or the source center (for transfer orders) from where stock is received at the current center. |
Status | The status of the order. For example, you may want to search for orders that are has the Created status. |
Qty | The total quantity of the products received as part of the order. |
Value | The total cost of the products after receiving them at the current center. |
Tax | The total tax paid by the current center on delivery. |
Notes | Any additional information or comments given by the inventory manager for the entire order. NoteThis is not the note given for a specific product. |
The number of days from when the order is raised until it is received fully at the current center. | |
Raise | You will see this button only if you have selected the following options: Order Type - Purchase Orders Order Status - Created To raise purchase order(s), select the order(s) and click this button to raise the order(s). This option is more appropriate when you want to raise purchase orders in bulk. |
You will see this button only if you have selected the following options: Order Type - Purchase Orders Order Status - Created To raise purchase order(s) and email the order(s) to a specific vendor, click this button. |
Retail Sales report
You can use the Retail Sales report to know the products that are sold at the current center based on a vendor from where the products were procured.
Follow these steps to run the report:
Select the center for which you want to run the report.
On the main menu, go to the Reports tab.
On the dashboard, click Inventory > Retail Sales. The report appears.
Select the filter criteria and click Refresh to see the report. Note:
Note
To export the report, click the Excel (
) or CSV () icons.
Filters
Criteria | Options | Description |
Product Type |
| Select the type of products for which you want to view the report. Select All if you want to view the report for both retail and professional supplies (consumables). |
Vendor NoteIf you do not see this filter, reach out to Zenoti to enable it for your business. | List of vendors associated with the current center | Select the vendor for which you want to view the report. For each product, the report is generated based on the following associations:
Select All Vendors to view the report for all the vendors associated with the current center. |
Sale Period |
| Select the date or date range during which the products were sold. Select Custom to select a date range. NoteFor custom dates, you can view data for a maximum date range of 6 months at a time. For example, if you wish to see data from January to August, first view data from January to June and then view data from July to August. |
Product Name, Tag | Search for a specific product by its name or code. You can also scan the product barcode. |
Column descriptions
Column | Description | Additional Information |
Vendor Code | The code that uniquely identifies the vendor. | |
Vendor Name | The name of the vendor. NoteIf the product is associated with multiple vendors, this column will show Multiple. | You may also see Unaccounted in this column. The unaccounted quantity in the audit is the difference between the current stock and the audited stock. If the inventory manager has entered more stock than the projected stock, the remaining stock in the center is considered as unaccounted. So, when a sale deducts the stock that is added up from an audit, the vendor for this instance is displayed as Unaccounted. |
Product Code | The code that uniquely identifies the product. | |
Product Name | The name of the product. | |
Qty | The total quantity of the product sold on the sale date or during the date range (as selected). | |
Sold By | The name of the employee who sold the product. |
Note
You can view the total quantity of each product at the end of the report.
Taxes - Purchases Tax Details report
You can use the Taxes - Purchases Tax Details report to view the tax paid by the current center to purchase products from a vendor.
Note
Note: First, try to enable this report for your organization. Refer to the Enable Specific Reports article for this. However, there is a chance that this report is not available for your organization. If so, you will not be able to see the report in the Reports > List of Reports section. If this is the case, reach out to your Zenoti representative to enable this report for you.
To run the report, follow these steps:
Select the center.
On the main menu, go to the Reports tab.
On the dashboard, click Inventory > Taxes (from the filter). The Inventory Tax Reports page appears.
From the list of reports, click Purchases Tax Details. The report opens in a new tab.
Select the filter criteria and click Refresh.
Note
To export the report, click the Excel (
) or CSV () icons.
Filters
Criteria | Options | Description |
Report Name |
| Lists all the tax reports for inventory.
|
Center Name |
| Lists the center name for which you want to run the report. NoteAt the Organization level, you can view this report for any center. |
Product Type |
| Lists the type of products: retail, consumable, or both. TipSelect All if you want to view the report for both retail and professional supplies (consumables). |
Vendor NoteIf you do not see this filter, reach out to Zenoti to enable it for your business. | List of vendors associated with the current center | Lists the vendors associated with the current center. TipSelect All Vendors to view the report for all the vendors associated with the current center. |
Delivery Date |
| Lists the date range during which the products were delivered. This can be the partial delivery date or the full delivery date. To select a date range, select Custom. NoteFor custom dates, you can view data for a maximum date range of 6 months at a time. For example, if you wish to see data from January to August, first view data from January to June and then view data from July to August. |
Search | Name, Code, Barcode | Lets you filter the report for a particular product. If you have selected a category and sub-category, the product you are searching for must fall under the select sub-category. If you are not sure of the category and sub-category, select All for both those filters. TipIf you want to view the sales of all the products at the current center, leave this field blank. |
Column descriptions
Column | Description |
Ref Num | The purchase order reference number. It is generated by Zenoti when the order is created. |
To | The name of the center where the order is delivered. NoteThis column is always the current center name. If the report is viewed at the Org level, this column shows the name of the center within the org. |
Delivered Date | The date and timestamp when the products are delivered at the current center. NoteEven for a partial shipment, a delivery date is recorded. |
Invoice-No | The number generated by the vendor on product delivery. For a single purchase order, there can be more than one delivery. So a purchase order can have multiple invoice numbers. |
Vendor Name | The name of the vendor from whom the products are procured. |
TIN# | The Tax Payer Identification Number (TIN) of the vendor. NoteIf your business is based out of the US, this is the Federal Taxpayer Identification. |
Vendor GSTIN | The PAN-based unique identification number of the vendor. NoteThis is only applicable for businesses that have GST enabled. |
Product | The name of the product. |
HSN | The code that classifies the product under GST. NoteThis is only applicable for businesses that have GST enabled. |
Tax Group | The tax group defined for inventory at the product level. |
Tax Percentage | The percentage of tax as defined in the tax group. |
Qty Delivered | The total quantity of products delivered at the current center. |
Cost | The unit price of the product at which the product is purchased. |
Tax Component | The tax component defined in the product. NoteYou may see more than one tax component based on the tax definition. |
Tax Amount | The total amount of tax paid by the current center to purchase the product. |
Total | The total amount paid by the current center to purchase the product. It is calculated as: Total = (Cost x Qty Delivred) +Tax Amount |
Inventory Audit History report
Ensure that you are at the center level.
Select Reports > Inventory .
Select either List of Audits or List of Audits by Products (to filter by product).
Select the time period and product details (if you selected List of Audits by Products), and then click Refresh.
The page displays a record of all audits for the selected time period, based on the selected filter criteria.
Click the Excel or CSV icons to export information.
Alerts report
You can use the Alert report to view the low-stock products and raise purchase orders for these products based on their desired level, order level, alert level, and recommended level (suggested by Zenoti).
Follow these steps to run the report:
Select the center.
On the main menu, click the Reports tab.
On the Reports Dashboard, click Inventory.
Select Alerts from the categories.
The Inventory Alert Reports page appears.
Select the filter criteria and click Refresh .
Note
To export to the report, click the Excel (
) or CSV () icons.To view the report in full-screen, click
Filters
Criteria | Options | Description |
|---|---|---|
Report Type |
| Select the product type for which you want to view the report. NoteBased on the selection, the columns vary. To view the report for both retail and professional supplies (consumables), select All. |
Category | List of product categories | The category to which the product belongs. For example, in Zenoti your business may have a category such as Hair Care. |
Subcategory | List of product subcategories based on each category | The subcategory to which the product belongs. For example, in Zenoti your business may have a sub-category such as Hair Styling for the category, Hair Care. |
Level |
| Select the level (order or alert) to view the products that are below that level. Select Below Any Level if you want to view the products that are either below the alert level or order level. |
Product Name, Product Code, or Product Barcode | You can use this search box to search for a product by its name or code. You can also enter the product’s barcode. |
Column descriptions
Column | Description | Additional Information |
|---|---|---|
Code | The code that uniquely identifies the product. It is more useful when you have multiple products with the same name. | |
Name | The name of the product. | |
Unit | The unit of measurement of the product. | For example, ml, gallon, oz, grams can be the units of measurement. |
Category | The category to which the product belongs. For example, in Zenoti your business may have a category such as Hair Care | |
Subcategory | The subcategory to which the product belongs. For example, in Zenoti your business may have a subcategory such as Hair Styling for the category, Hair Care.. | |
Vendor NoteIf you do not see this filter, reach out to Zenoti to enable it for your business. | The name of the vendor with which the product is associated. | |
Current Store | The total quantity of the product in the store. NoteIf you select All from the Report Name filter, you will see this column for Retail and for Consumable separately. | Example: The quantity of the product in Retail is 10 and in Consumable it is 20, you will see Retail-Current Store as 10 and Consumable-Current Store as 20.In case the product is marked as only retail, and if you have selected All from the Report Name filter, the Consumable-Current Store will show as 0. The same applies if the product is marked as only consumable. |
Current Floor | The total quantity of the product on the floor. NoteIf you select All from the Report Name filter, and the product is marked as both retail and consumable, you will see this column for Retail and for Consumable separately. | Example: The quantity of the product in Retail is 10 and in Consumable it is 20, you will see Retail-Current Floor as 10 and Consumable-Current Floor as 20.In case the product is marked as only retail, and if you have selected All from the Report Name filter, the Consumable – Current Floor will show as 0. The same applies if the product is marked as only consumable. |
Current Inventory | The total quantity of the product (store and floor). NoteIf you select All from the Report Name filter, you will see this column for Retail and for Consumables separately. In case the product is marked as only retail, and if you have selected All from the Report Name filter, the Consumable – Current Floor will show as 0. The same applies if the product is marked as only consumable. | Example: The quantity of the product in Retail is 10 and in Consumable it is 20, you will see Retail-Current Inventory as 10 and Consumable-Current Inventory as 20. In case the product is marked as only retail, and if you have selected All from the Report Name filter, the Consumable – Current Inventory will show as 0. The same applies if the product is marked as only consumable. |
On-Hand Qty | The total quantity of the product (store and floor). NoteIf you select All from the Report Name filter, you will see this column for Retail and for Consumables separately. In case the product is marked as only retail, and if you have selected All from the Report Name filter, the Consumable – Current Floor will show as 0. The same applies if the product is marked as only consumable. | If your business has signed up with Zenoti after April 2020 release, you will only see the On-Hand Qty column- you will not see the Current Store, Current Floor, and Current Inventory columns. |
UndeliveredQty | The quantity of the product raised in a purchase order or transfer order. NoteIf you select All from the Report Name filter, you will see this column for Retail and for Consumables separately. | ImportantThis column is displayed only if Consider raised purchase orders/transfer orders for calculating Auto PO/TO quantity (Configuration > Inventory > Orders )is enabled. |
Desired Level | The quantity of the product that you must have in stock at any time to run your business smoothly. This is defined by your admin while creating the product. | NoteIf you select All from the Report Name filter, you will see this column for Retail and for Consumables separately. |
Order Level | The quantity of the product that should be ordered to maintain the desired level. This is defined by your admin while adding the product. At times, this can also be the vendor lot size, which can be more than the required stock. Your business decides the order level for each product. | NoteIf you select All from the Report Name filter, you will see this column for retail and for consumables separately. |
Alert Level | The minimum stock quantity that you must have on hand to run your business until your inventory is replenished. This is defined by your admin while creating the product. | NoteIf you select All from the Report Name filter, you will see this column for Retail and for Consumables separately. |
Recommended Level | The quantity of the product as auto-calculated by Zenoti. Recommended Level = Desired Level – (Current Inventory + UndeliveredQty) | UndeliveredQty is the total quantity that is raised in a purchase order or transfer order. |
Expenditure report
The Expenditure report provides a graphical and tabular representation of the amount spent to procure products at the current center. You can compare the actual expense incurred with the projected expense calculated by Zenoti.
Note
Note: First, try to enable this report for your organization. Refer to the Enable Specific Reports article for this. However, there is a chance that this report is not available for your organization. If so, you will not be able to see the report in the Reports > List of Reports section. If this is the case, reach out to your Zenoti representative to enable this report for you.
Follow these steps to run the report:
Select the center for which you want to run the report.
On the main menu, go to the Reports tab.
On the Reports dashboard, click Inventory > Expenditure.
The report appears.
To view the report in graphical format, select the sale date from the filter and click Refresh.
The report displays a graphical illustration of the data. The vertical bar graph shows the category or audit date, while the horizontal bar graph shows the expense (projected and actual).
Note
To export the data, on the top right corner of the table, click the Excel (
) or CSV () icons.To view the report in tabular format, select the sale date from the filter and click Data.
Filters
Criteria | Options | Description |
Report Name |
| Select the desired option to view the report by a category or by the audit date. |
Product Type |
| Select the type of products for which you want to view the report. Select All if you want to view the report for both retail and professional supplies (consumables). |
Date |
| Select the date or date range for which you want to view the report. Select Custom to select a date range. NoteFor custom dates, you can view data for a maximum date range of 6 months at a time. For example, if you wish to see data from January to August, first view data from January to June and then view data from July to August. |
Graphical format
When you select the filter criteria and click the Refresh button, the report opens in graphical format.
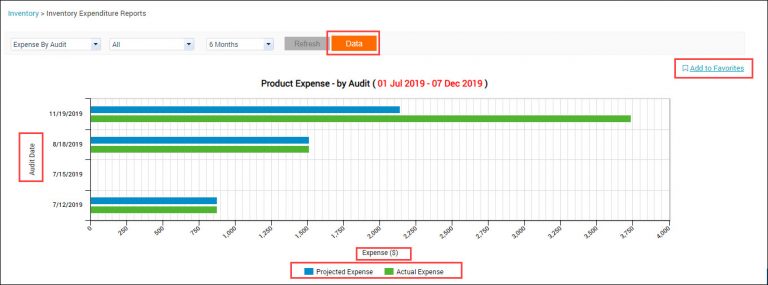
Click the color codes for various items, below the graph, to remove or add the corresponding details to the graph. For example, if you click the blue color code for Projected Expense, Zenoti does not consider projected expenses for the specified date range in the graphical report. However, when you click it again, the projected expenses are considered in the graphical report.
Note
If you want to view the report by considering the projected expenses, click the Projected Expense color code to view details in the report again.
Click Add to Favorites to bookmark this report.
Tabular format
When you select the filter criteria and click the Data button, the report opens in a new window.
The table displays Category, Actual Expense, and Projected Expense incurred to purchase the products in a specific category.
The table displays Audit Date, Actual Expense, Projected Expense incurred to purchase the products in a specific category. You can also view the value of your stock (Stock Value) on the date of each audit.
For calculations, refer to the Product Expense Graph report.
Inventory Aging report
Use this report to track products sitting on your shelf for a long time. Based on the data available in this report, you can then prioritize using older products over newer ones to avoid letting stock expire on the shelves.
Example: Your center has 20 bottles of aloe vera shampoo and data in this report indicates that 5 bottles are 60 days old. To minimize wastage, you can now place those 5 bottles on the first row of your shelf so that therapists use them before they use the newer stock for services such as hair wash, or your front-desk will give those to guests in the case of a retail sale.
Note
Note: First, try to enable this report for your organization. Refer to the Enable Specific Reports article for this. However, there is a chance that this report is not available for your organization. If so, you will not be able to see the report in the Reports > List of Reports section. If this is the case, reach out to your Zenoti representative to enable this report for you.
At the organization or center level, click the Reports icon.
On the Reports page, search for and select the Inventory Aging report.
If the report has many columns, scroll horizontally to the right or left to view all columns.
To view specific data on the report, select the desired filters. For more information, refer to report features on Zenoti.
Click Refresh.
If you generate the report for over a year, click the Email button.
Important
All data displayed in this report is as of the current date.
This report follows the inventory management method of selling older inventory first, that is goods purchased first are sold first.
Column descriptions
Column | Description |
|---|---|
Center Name | Center where the product is logged in the inventory |
Product Name | Name of the product |
Product Code | The unique code that identifies the product |
Product Type | The Product type such as consumable, retail, or all |
UOM | The unit of measurement of the product For example, ml, gallon, oz, grams can be the unit of measurement. |
Vendor | Vendor with which the product is associated |
On-Hand Quantity | Total quantity of the product |
Age: 0-30 days | Number of items in inventory for less than a month |
Age: 31-60 days | Number of items in inventory between one and two months |
Age: 61-90 days | Number of items in inventory between two and three months |
Age: >90 days | Number of items in inventory for over three months |
Last Stock Inflow (days) | Number of days since the product stock was last replenished |
Sales/Consumption (Last 90 days) | Number of units of product sold or consumed in the last 90 days |
Avg Price (Perpetual) | Perpetual average cost of the product for the transaction. For more information and context on perpetual average cost, refer to the Perpetual average cost article. |
Pending Delivery Qty | Quantity of the product pending delivery (in progress orders) |
Alert Quantity | Minimum stock quantity of the product required until inventory is replenished If the quantity drops below this level, notifications are triggered |
Desired Quantity | Quantity of a product to be stocked for smooth inventory operations |
Suggested Quantity | Suggested quantity to order. This is the difference between desired quantity and the on-hand quantity. Example: Let’s say that the desired level of a product is 100 bottles, but you have only 30 bottles left in stock. In this case, the suggested quantity is 70 and you have to order 70 bottles to maintain the desired level. |