Membership Metrics dashboard
This dashboard gives you a comprehensive understanding of how your memberships are performing. It also helps you to identify guests who are ideal for membership upsell based on their use of services.
View Definitions of KPIs and see how each KPI maps to a core report
To view the membership metrics dashboard
At the organization level, navigate to Data & insights > Analytics.
On the Analytics Express tab, click Membership Metrics.
By default, the dashboard shows you the data for all the centers to which you have permissions.
To filter your dashboard data
The filters help you focus on the data that is important to you.
Filters | Description |
|---|---|
Center | Lets you filter the data to see information about all, one, or a set of centers. |
View By | Lets you set the durations by which you want to compare the data. The available options are - Day, Week, Month, Quarter, and Year. |
Time Period | Lets you set the durations for which you want to compare the data. The available options are - WTD (week-to-date), MTD (month-to-date), Previous Month, QTD (quarter-to-date), YTD (year-to-date), and Custom (lets you set the start date and end date for the dashboard). |
To learn how to save filters and customize your default view, refer to Use Custom Views
Anatomy of the dashboard
At the top of the dashboard, you get a macro-level view of how the memberships are performing. On the bar you see:
Total collections from memberships
Percentage of total collections made up by memberships
Percentage of non-members who bought memberships

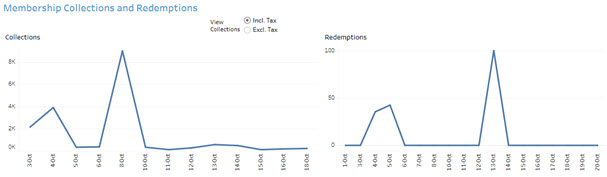
Membership Collections and Redemptions
This section shows how your Memberships Collections and Membership Redemptions are trending. The graph on the left shows your Memberships collections inclusive or exclusive of tax. The graph on the right shows your redemptions and payments done in the invoice through Memberships Credits and Membership Benefits.
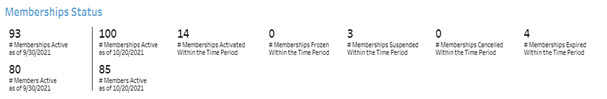
Membership Status
This section of the dashboard gives you the count of the memberships for a particular status based on the selected time period. It gives information about how many active memberships were there at the start of the time period and how many got frozen, suspended, cancelled, expired, or newly-activated in the time period and at the end of the time period how many are active. It also shows how many members are active as of the start and end date of the selected time period.
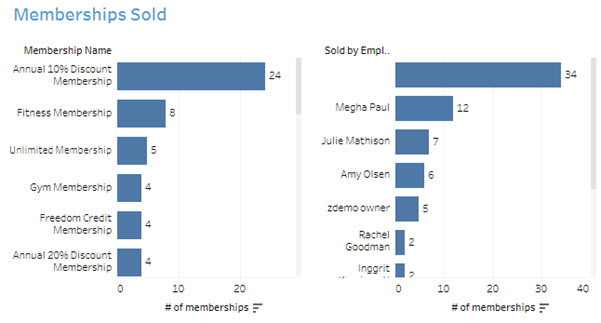
Memberships Sold
This section helps you identify your top-selling memberships, which then helps you identify which memberships you want to focus on to improve sales. The graph also shows you which of your employees is selling the most number of memberships.
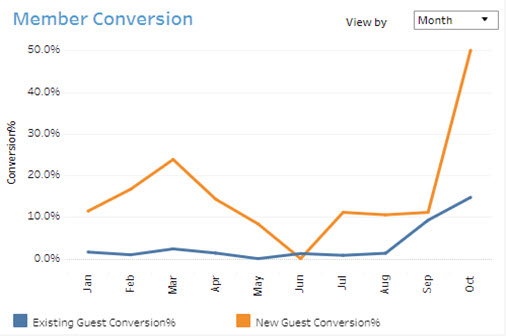
Member Conversion
This section shows you the percentage of guests who were not having any active membership and purchased a membership within the selected time period. It breaks up this number between existing guests and new guests. You can use the View By list to see this by month or by day.
Guests Ideal for Upsell of Memberships report
This page identifies guests who have never purchased memberships but have visited your business frequently in the selected time period
To navigate to this page, click the Click here for Guests Ideal for Upsell of Memberships report hyperlink.
By default, this page displays data for the previous 3 months. Use the Time Period (Last N Months) dropdown to select different time periods. You can select to display the last 3, 6, 9, or 12 months of data.
Using the drop down, you can filter the list to show you guests who visited you at least 3, 6, 9, and 12 times in the last 1 year.
The table shows how many times they used a particular service from each service category. This information will help you identify guests who are ideal for membership upsell. It will help you identify which memberships will match their use of your services.
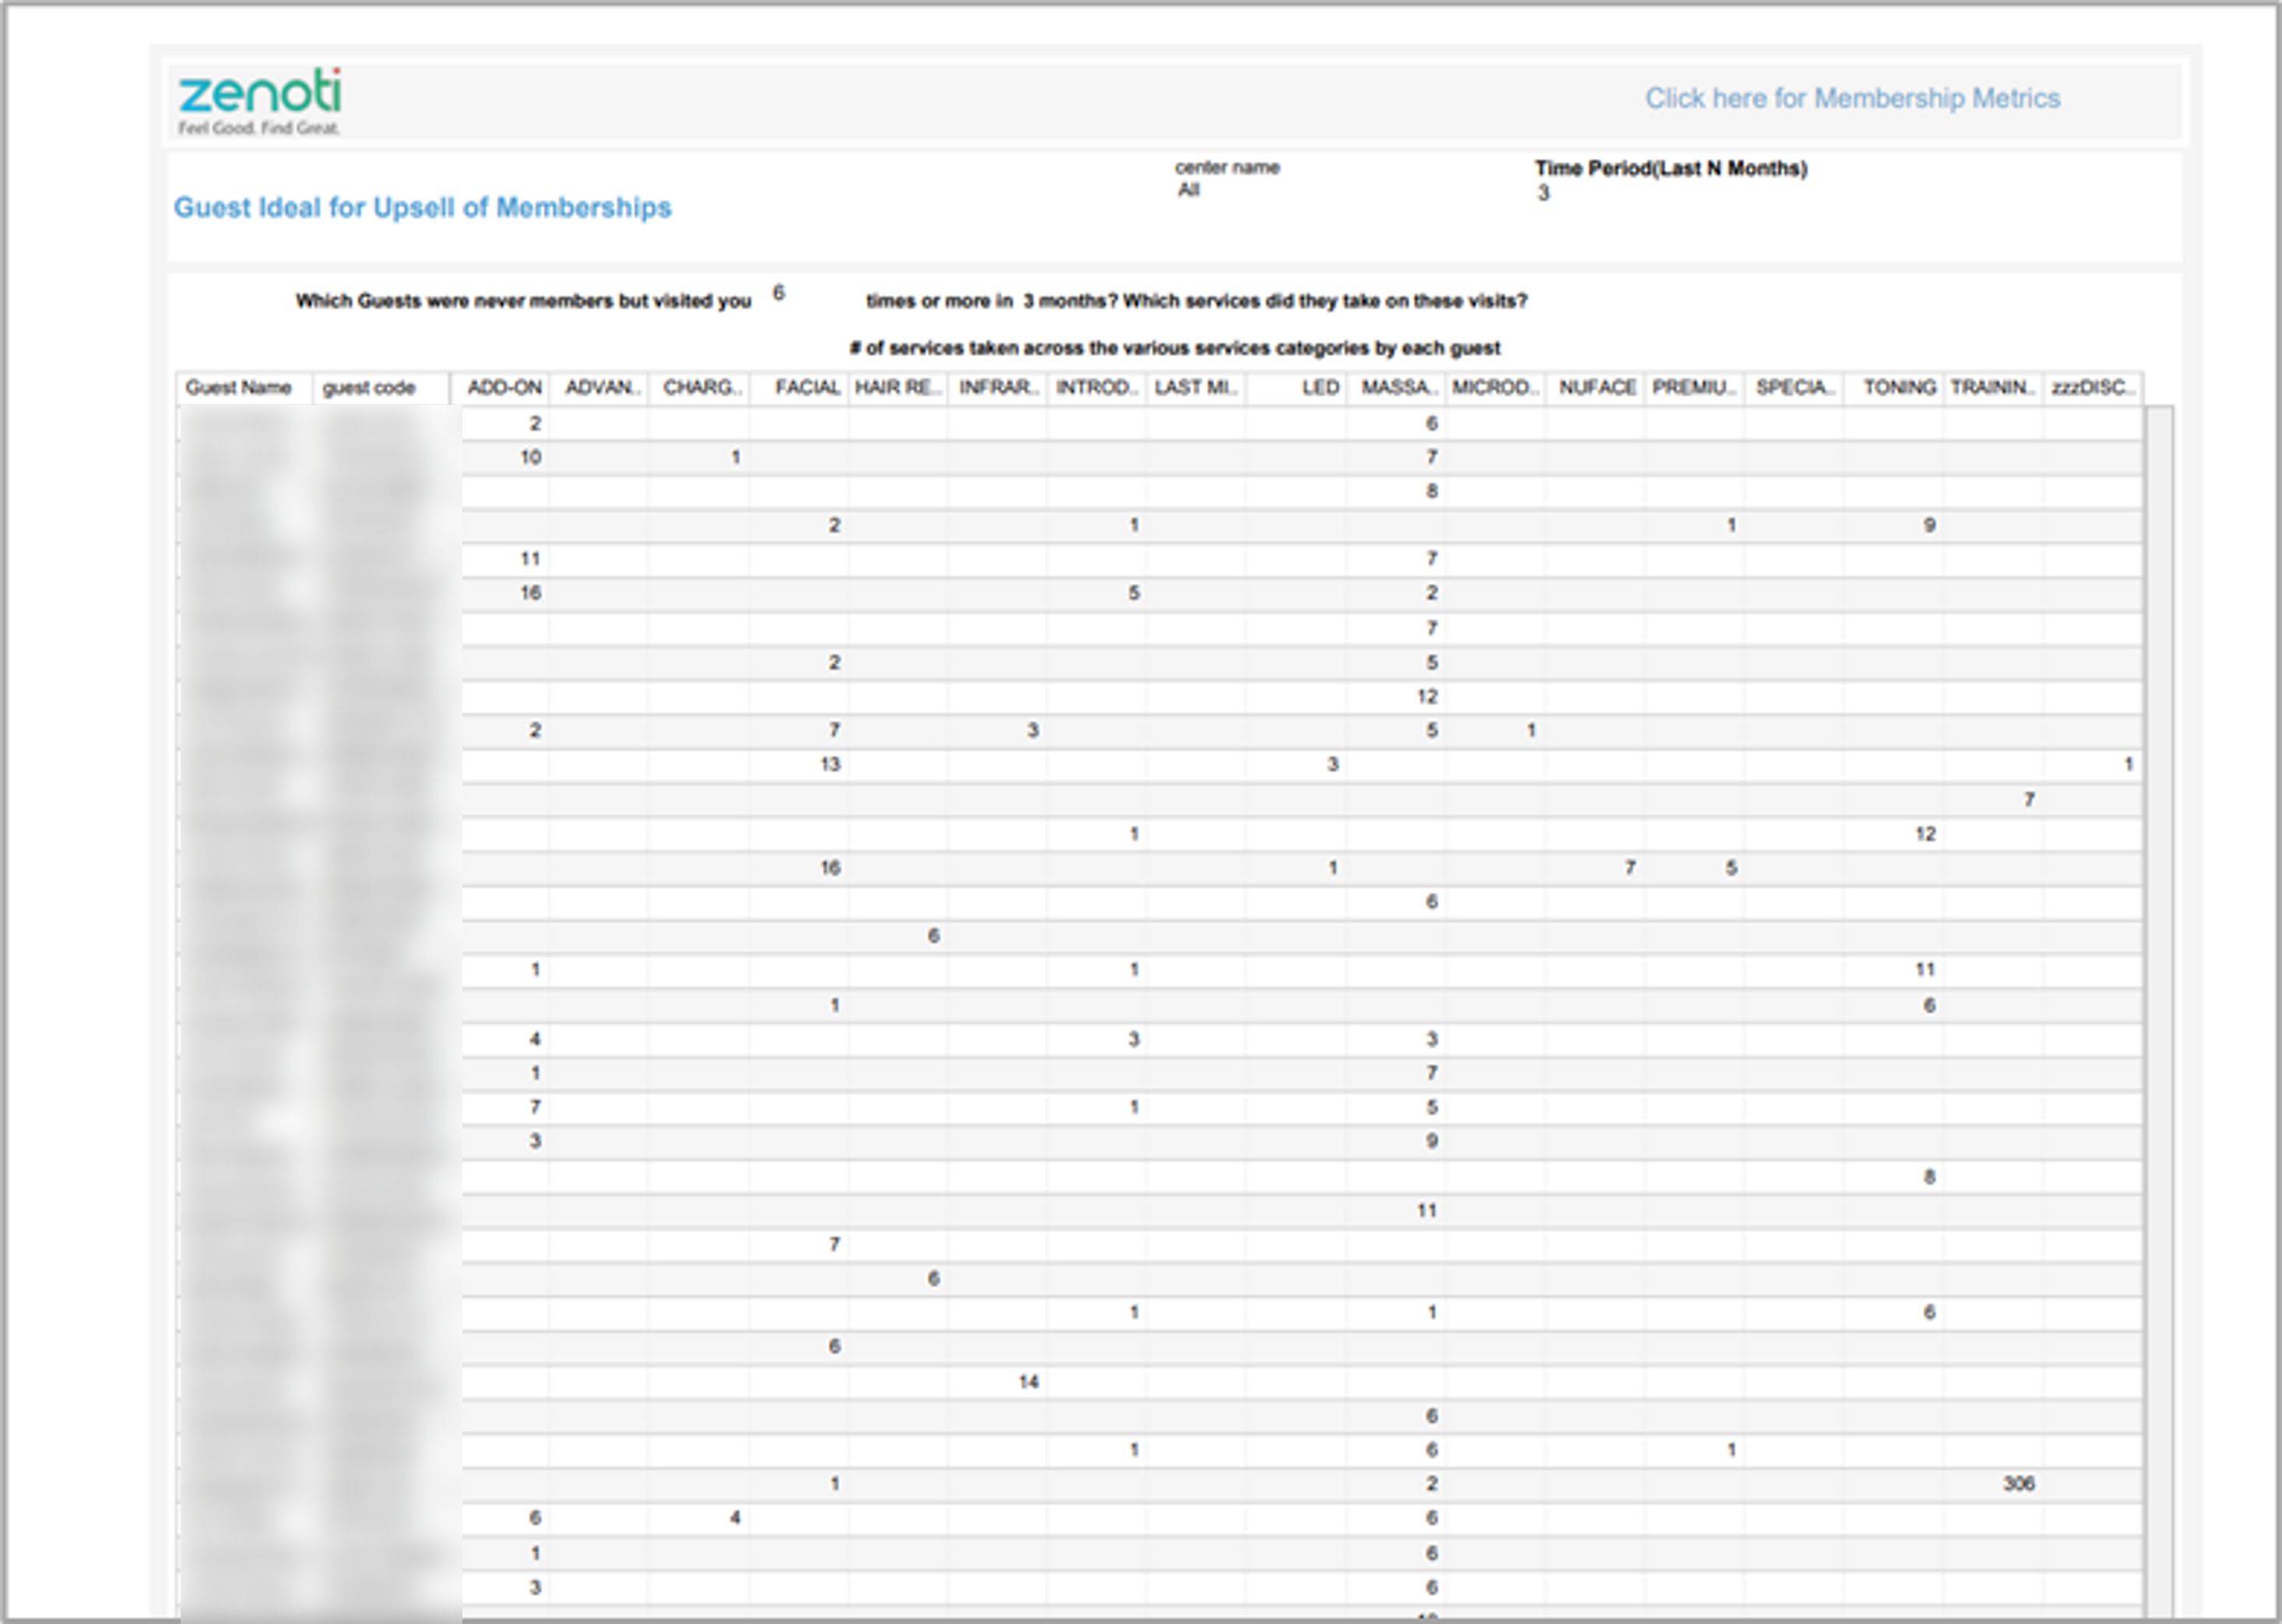
Note
You can go back to the Membership Metrics dashboard by clicking the Click here for Membership Metrics hyperlink.