Access the Zenoti Driven Growth dashboard
This article explains how to access, configure, and use the Zenoti Driven Growth dashboard to track the impact of growth features on your business. It includes steps to enable access, assign permissions, and interpret key metrics.
Overview
To monitor and measure the impact of growth features on your business, Zenoti provides a Zenoti Driven Growth dashboard that offers real-time insights into key performance metrics.
Note
This feature is not enabled by default. Reach out to your CSM or Zenoti representative to enable this feature for your business.
Prerequisites
Role permissions to view the Zenoti Driven Growth dashboard
To grant a user permission to view the Zenoti Driven Growth dashboard, follow these steps:
At the organization level, click the Configuration icon.
Navigate to Security > Security roles.
Select a role and click the Permissions tab.
Expand the Data & Insights section, and for Growth Story, select the View checkbox.
Access the Zenoti Driven Growth dashboard
To view the Growth Features dashboard, follow these steps:
Navigate to the Zenoti Driven Growth dashboard using one of the following options:
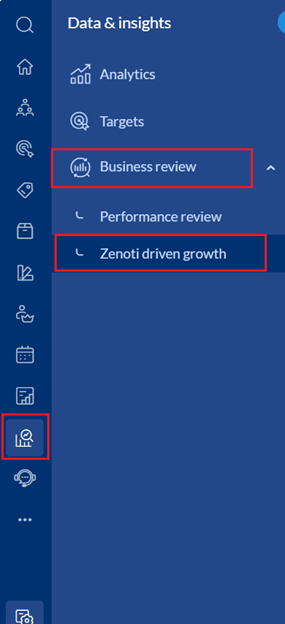
At the organization, zone, or center level, navigate to Data & insights > Business review > Zenoti driven growth.
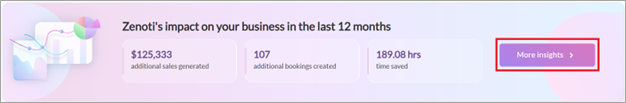
At the organization or center level, click More Insights in the “Zenoti's impact on your business in the last 12 months” section of the Admin Dashboard.
From the dropdown list at the top of the dashboard, select to view either the overall value or the average value per center.
Select the timeframe from the calendar dropdown list on the top-right corner of the screen. For example, select Last year to view the dashboard data for the previous year.
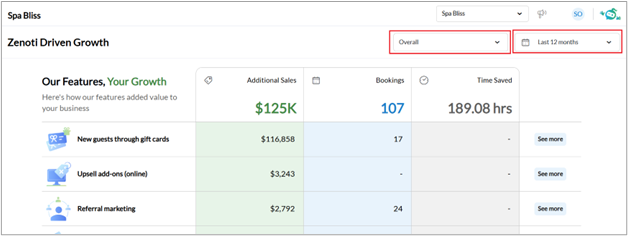
The dashboard displays data for the following metrics related to the growth features available to you:
Additional Sales: Additional sale value generated through the feature
Bookings: Number of bookings completed through the feature
Time Saved: Total time saved by using the feature
Note
Features are sorted in descending order of impact, with the most valuable ones listed at the top. For example, if Referral marketing generated the most value, then it would appear on top of the list of features.
Click the See more button to view the data for any feature in more detail.

Click the Download button to download the detailed report for the feature as an Excel file.

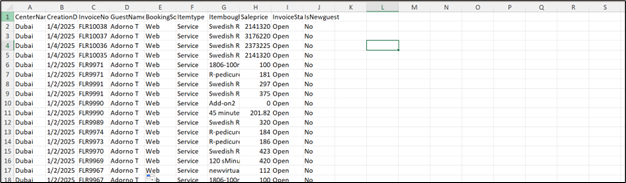
Note
You can download these feature reports only for the Current month and Last month.
Click the contextual help icon next to the feature name to access the related help article.
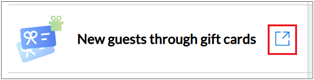
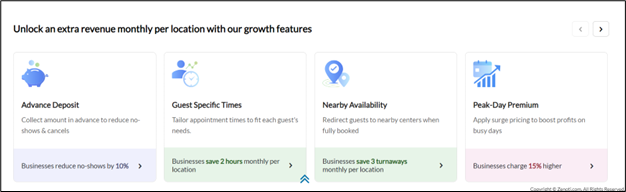
The Zenoti Driven Growth dashboard also displays suggested features at the bottom section of the screen. To know more about how these features will help your business grow further and generate value, click the desired feature.