Current stock
Review the current stock - v1 report
Important
This is a legacy report. Businesses that have signed up with Zenoti after April 2022 do not have access to this report.
At any point, you want to know the available stock in your center. It is imperative to know the movement of your inventory at any time and the count in each bucket: inflows and outflows, checkouts, consumptions and conversions, bundling/unbundling, restocks and discards, on-hand store, and on-hand floor.
In Zenoti, Current Stock gives you a report on your inventory since the last reconciliation. It also gives you the total stock value by considering the stock in all the buckets. You can refer to this report at any time in your day and decide on your procures and transfers.
Note
To know the value of your current stock, Zenoti recommends that you view the Value report. You can use this report to view the value of your stock for a period of time.
Current stock levels update with every:
Reconciled Audit and Approved Reconciliation - updates opening quantity
Received Purchase Order, Conversion, UnBundle, and Restock - updates inflow quantity
Received Transfer Order - updates in-transit quantity
Dispatched Transfer Order, Delivered Purchase Order, Sale, Consumption, Conversion, and Bundle - updates outflow quantity
Important
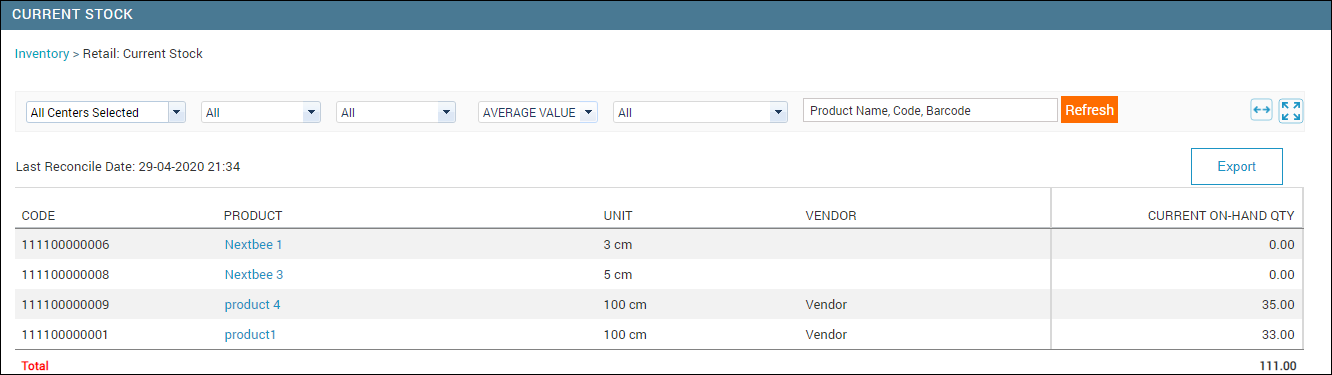
For businesses that have signed up with Zenoti after April 2020 release, the store and floor quantities are combined into a single quantity, called Current On-Hand quantity.
At the center level, navigate to:
For Retail: Inventory > Retail > Current Stock- For Professional Supplies: Inventory > Consumables > Current Stock
Important
You can also view the total on-hand stock for all centers at the org level.
Note
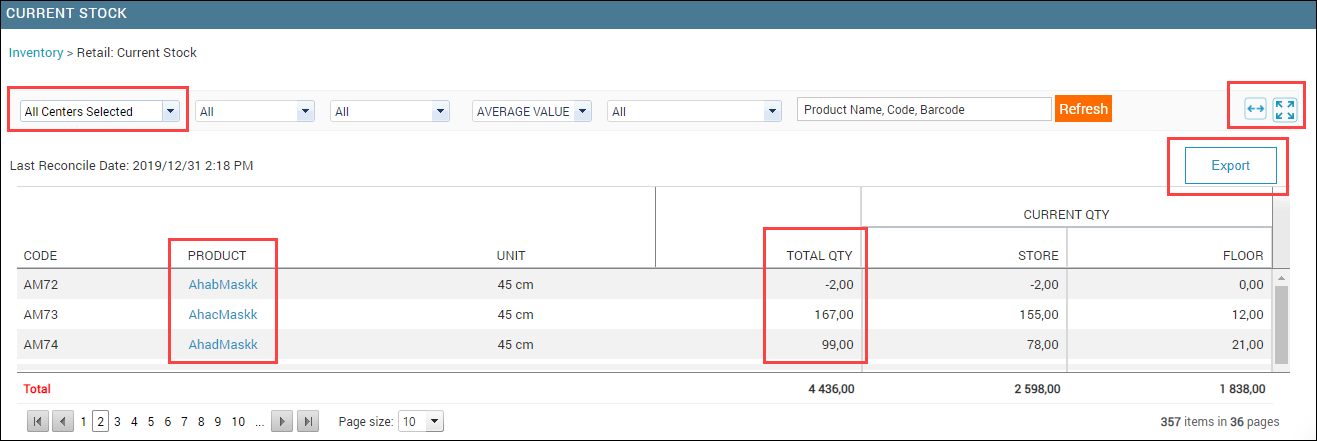
You can see the last reconciliation date to know how recent the opening quantities are.
On the Current Stock page, click a product name to view the history of all transactions that happened on it.
The Product Transaction History window for the product opens. You can look at the various stages the product has been through and how the product quantity and value is updated at each stage.
Search for the products by:
Category/Subcategory
Vendor to which the products are associated in Zenoti
Value by: Average value or FIFO value
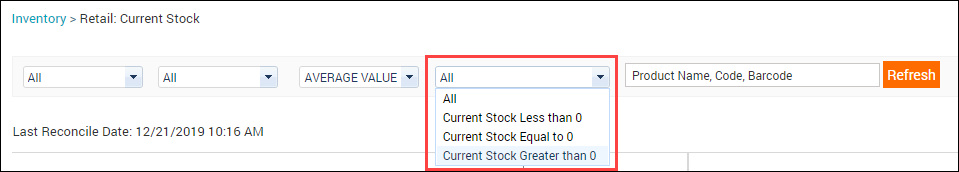
Stock Level
Time duration to view the product history in a specific window of time
Click the Refresh button to view the results based on the search criteria.
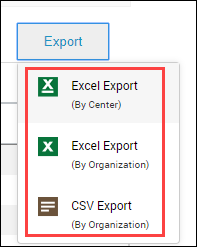
Click Export to export the current stock data to Excel or CSV format.
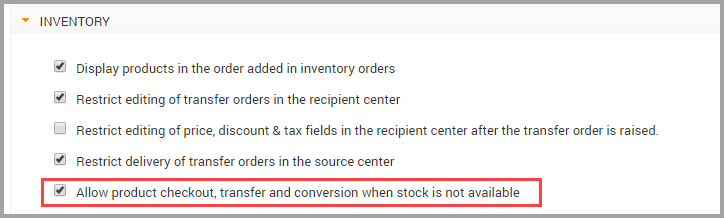
Your Admin can control how the current stock level is considered during checkouts, transfers, and conversions with the following setting at the Org level:
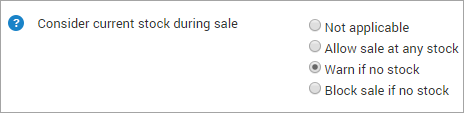
At center level, your Admin can control product sales with respect to available stock:
View total on-hand stock for all centers
A warehouse is a center that manages the stock of the entire organization. It procures stock from the vendors and dispatches stock to individual centers. In this purchase model, the warehouse needs to know the stock at each center and procure stock accordingly.
The Current Stock page at the organization level gives the warehouse a birdseye view of the entire on-hand stock at all centers.
Important
For businesses that have signed up with Zenoti after April 2020 release, the store and floor quantities are combined into a single quantity, called Current On-Hand quantity.
Navigate to the Current Stock page.
For Retail: Inventory > Stock Levels > Retail > Current Stock
For Professional Supplies: Inventory > Stock Levels > Consumables > Current StockLet’s say that you want to review the retail stock levels. On the navigation, you will see the following page:
If you have signed up with Zenoti after April 2020 release, you will see the following page:
Note
Use the Export drop-down list to export the report to Excel (for one center or for all centers) and CSV (for all centers).
Click the product link to view the on-hand stock of the product for each center.
Note
The stock for the product is listed only if the product is associated to the center.
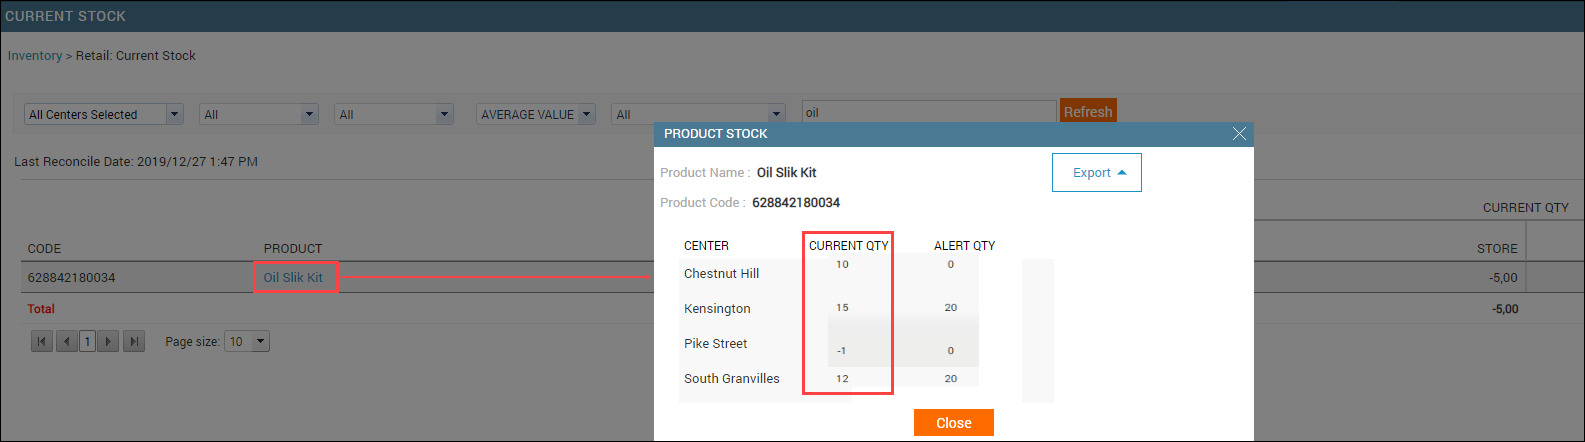
You can also view the alert quantity defined for each product at a specific center.
Note
Use the export options from the Export drop-down list to export the center-wise on-hand stock and alert levels to Excel or CSV format.
If you want to view the stock of an individual center, select the desired center from the Centers drop-down list. Select other criteria and click Refresh.
Adjust stocks using inventory adjustments
Zenoti inventory allows you to manage stock damages, shrinkage, and spoilage by allowing you to adjust stock instantly to account for any damages, vendor frauds, free samples, or expired stock.
Note
All inventory adjustments are captured in a log and displayed in product transaction history and adjustments history.
Inventory adjustments are of two types:
Manual adjustments: You can create adjustments manually in case of damages, shrinkage, and spoilage.
Auto adjustments: Enable you to track fraudulent activities by viewing all audits for products that were reconciled. When audit reconciliations are performed with a difference in stock between the system values and audited values, auto adjustments are created and displayed in the adjustments report.
Important
Contact your administrator to set up the permissions for inventory adjustments.
View, add, and edit adjustments
At the center level, click the Inventory icon.
To access adjustments for retail or consumable products, depending on the type of product, navigate to Retail > Adjustments or Consumable > Adjustments.
Note
You can view this page at the organization level in read-only mode.
Caution
Existing financial and edit locks apply to all actions on this page.
Use filters such as Category, Sub-category, Reasons, Adjusted By, Source, and Product Name, Code or Barcode to view products belonging to specific categories or sub-categories.
You can also drag columns into the grouping area to group your data meaningfully.
Click Refresh.
Footer totals display cumulative amounts for all adjustments and per grouping when applied.
The following table describes the columns you see and actions you can perform:
Name
Description
Date
Date on which the adjustment was created
Product
Name of the product for which the stock was adjusted
Adjusted quantity by store (+/-)
Quantity adjusted by the store
Note
If your business does not operate in the store and floor model, this is displayed as just adjusted quantity.
Adjusted quantity by store
Quantity adjusted on the floor.
Quantity (+): The number of units added to inventory.
Quantity (−): The number of units removed from inventory.
Note
If your business does not operate in the store and floor model, this is displayed as just adjusted quantity.
Value per unit
Sale price of the product
Note
Only non-zero perpetual average values are considered. When you finish selling the products from the last PO, for products added without a PO/TO, the last non-zero value is considered. For example, your last PO had 3 products with a value of $10. After the sale of these products, instead of a zero perpetual value, all new products will have a value of $10.
For both manual and auto adjustments, the previous non-zero value and the current value of zero are available for selection. For all adjustments created after Feb 2023, the previous non-zero value is assigned by default. However, you can edit this value.
Transaction cost (+/-)
Total cost of the adjustment = Adjust Store Quantity by x Value Per Unit
(Cost (+): The total cost of the quantity added (Quantity (+) × Value per Unit).
Cost (−): The total cost of the quantity deducted (Quantity (−) × Value per Unit).
Reason
Reason for adjustment
Source
Source of adjustment
Adjusted by
Name of the employee who created the adjustment
Actions/Buttons
Description
Add
Click to add a new adjustment. On the New adjustment window, enter all the required values and click Save.

Notes
Hover over the icon to view notes added on the adjustment.

Edit
Click to edit an adjustment. You can update all values in a manual adjustment, but you can edit only the value per unit in an auto adjustment.

Delete
Click to delete an adjustment. Only auto adjustments can be deleted.
FAQ and troubleshooting
Why I cannot view current stock?
You cannot view the current stock for a center for one of the following reasons:
You do not have the center associated to your profile.
Reach out to your Admin for access.
You have not conducted stock count for more than 3 months.
Go ahead and conduct an audit or stock count for both retail and consumables.
Why I do not see product category and subcategory in the report?
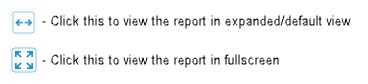
By default, the report generates in compact mode. To view the product category and subcategory and other details, view the report in extended view.
Why I cannot export the report?
You may not have the Export permission enabled for your role.
Reach out to your Admin for access.
I am unable to export the complete report?
If you are viewing the report in compact mode and you generate the report, you will not see all the details. View the report in extended mode and then export the report.
Why I don't see the value of my stock?
You may not be able to view the value of your on-hand stock for the following reasons:
You cannot see the Value column as the Hide Price permission is enabled for your role. This permission controls if you are allowed to see stock value in various inventory pages.
You see zeroes for value due to the following reasons:
Unit price or MRP is not defined for the product
Purchase Order is not entered for it in the system
Why I cannot click a product link?
The product is not associated to any vendor. In Zenoti, each product must be associated to at least one vendor in order to perform any action on the product. For more information, read our help article on vendor-product association.
Can I view current stock for all centers?
Yes. You can view the total current stock of all centers at the organization level.
Why do I see the current stock of a product not the transaction history when I click a product link?
You are viewing the current stock report at the organization level.