Zenoti Analytics Plus
Introduction to Analytics Plus
Analytics Plus is a custom dashboarding solution that enables you to create your own analytics dashboards. You can use Analytics Plus to configure the way crucial metrics of your organization are calculated and visually represented. In addition, the analytics data is readily available at your disposal whenever you require.
This article helps you get started with connecting to and using Analytics Plus.
Here are a few more key features of Analytics Plus:
Connect to your data – Connect to about 25 different data sources across various dimensions of your business by using Analytics Plus. For example, data sources such as Appointments Data Model and Sales Data Model.
Publish your own dashboards – Use the Tableau Web interface to create, customize, and publish your own analytics dashboards.
Share and favorite dashboards – Share customized analytics dashboards with your employees and mark important dashboards as Favorite for quick and easy access.
Zenoti allows access to Analytics for a maximum of four users per center. For all Analytics users, we provide Viewer permissions to Analytics Plus dashboards by default. For users who would like to author dashboards, we provide Explorer permissions on request.
Note
All permissions are associated with usernames. For some reason, if you have to change your username, please be noted that all permissions will be lost and cannot be carried over to the new usernames. This is applicable for SSO as well.
If you require any functionalities beyond what Tableau Web supports, you must purchase a Tableau Desktop license directly from Tableau. We enable the server connection from Tableau Desktop by providing you the required credentials. Zenoti does not provide the Tableau Desktop license as part of the Analytics Plus offering.
Zenoti's Tableau infrastructure allows you to connect to these five types of external data sources: Redshift, SQL, MySQL, Google Sheets, and Postgres; we do not support other data types.
Note
You must possess the necessary expertise of the Tableau tool to successfully use Analytics Plus.
Connect to Analytics Plus and create a simple dashboard
In Zenoti, from the main menu, navigate to Data & insights > Analytics.
The Analytics page opens.
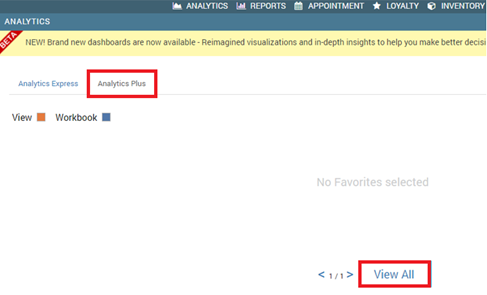
Click the Analytics Plus tab.
All the custom dashboards that you publish and mark as Favorite are displayed under this tab.
Note
This tab is enabled only if you have signed up for Analytics Plus.
To create a dashboard, click View All.
The Tableau Web interface opens on a new tab.
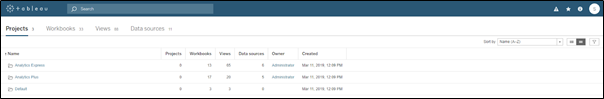
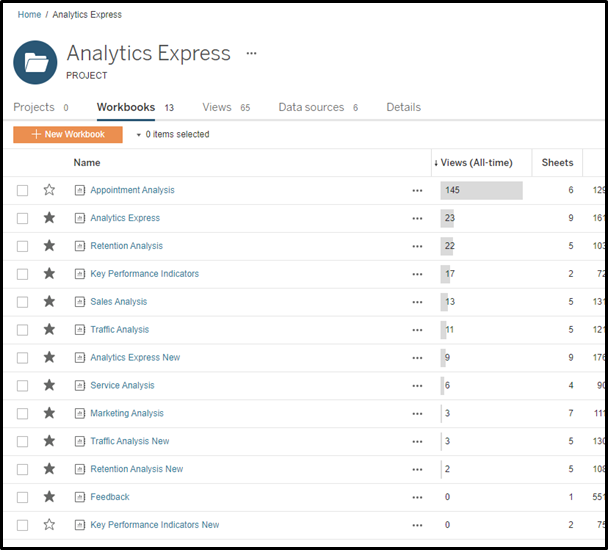
Under the Projects tab, click Analytics Plus.
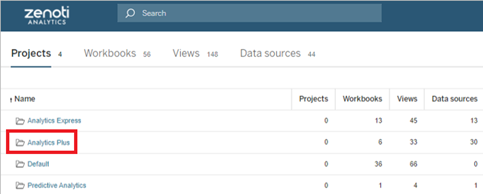
The Analytics Plus page opens. All the dashboards that you create and publish are displayed on this page.
Click New Workbook.
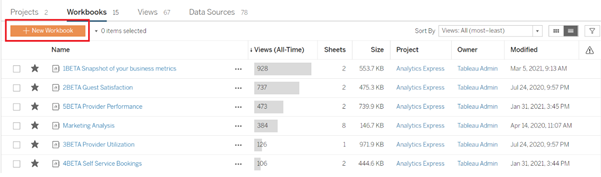
The Tableau Web dashboard builder opens on a new tab.
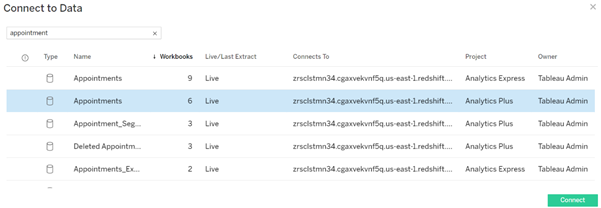
The Connect to Data window displays all the data sources that are available in the Analytics Plus project.
In the Connect to Data window, search for and select the required data source, and then click Connect.
The New Workbook page opens with the selected data source displayed under the Data tab.
All the fields of the data source are displayed under the Dimensions and Measures sections.
Use the Marks section to make various visual formatting changes, such as the color, size, and type of the visual representation of data.
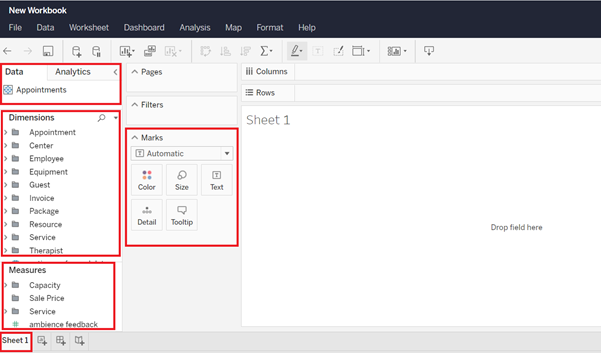
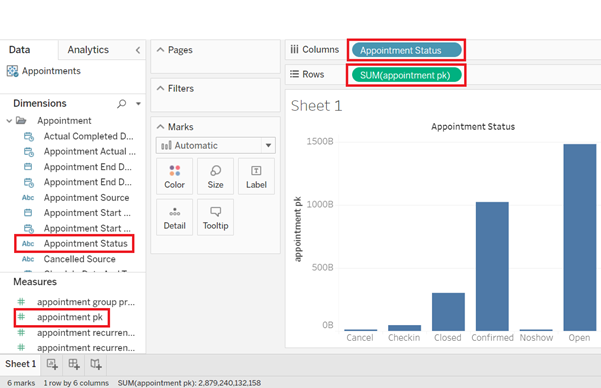
Drag and drop the required fields from the Dimensions and Measures sections either directly into the workspace area or into the Columns and Rows fields.
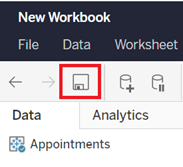
After you have created and formatted the worksheet, near the lower-left corner of the screen, click the New Dashboard icon.
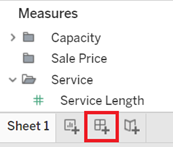
A new dashboard opens with the newly created worksheet displayed under the Sheets section on the left pane.
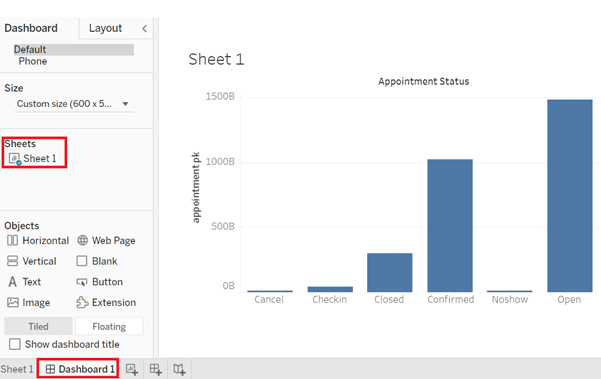
In the dashboard, from the Sheets section, drag and drop the worksheet into the workspace area. Make any changes to the dashboard as necessary.
To save the dashboard, click the Save icon.
After you have saved the dashboard, it is displayed in the list of published dashboards on the Analytics Plus page.
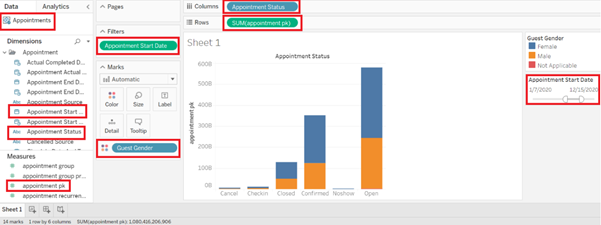
Here is a simple worksheet in which we have selected the Appointments data source. This worksheet illustrates the number of appointments for each type of appointment status during a selected period (from Jan 7, 2020 to Dec 15, 2020). The colors indicate the split of appointments based on the gender of the guests.
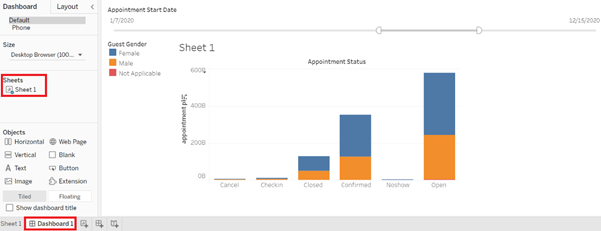
Here is the dashboard after we have added the worksheet to it.
Get started with Tableau
Disclaimer
This article links to the Tableau site. Zenoti will not be responsible for any changes to the locations of these resources.
Learn how to build basic reports/dashboards in Tableau online - The following Tableau training resource focuses on visual analytics and on calculations
Note
We recommend that you explore the calculations section of the training after you are familiar with the basic usage of drag and drop and build features.
Learn more: Starter kits
Connect to Tableau Desktop
From the main menu, navigate to Data & insights > Analytics.
On the bottom-left corner, click View All. You can also click any of the dashboards.
The user will be authenticated and logged into Zenoti Analytics Tableau site.
Copy the URL from the Tableau site. The URL will be in the “ https://<>.zenoti.com” format.
Open Tableau Desktop, place your mouse pointer over the Server menu option, and then click Sign In.
Paste the URL copied in the previous steps and click Connect.
If you have publisher access, you will be connected to the Tableau server. A new tab will appear in the browser.
In Tableau Desktop, place your mouse pointer over the Server menu option and verify that you are signed into Tableau Server.
After you are logged into Tableau Desktop, you can build, edit, or publish dashboards.
Favorite reports
Analytics Plus gives you a whole host of reports to help you understand the state and health of your business. However, there will be some reports you might want to look at more often than others. Instead of ploughing through the whole list of reports, you can add links to these reports on the Analytics Plus home page by marking them as favorites. This makes them easy to access and saves you time.
Mark a report as favorite
At the organization or center level, navigate to Data & insights > Analytics.
On the Analytics page, go to the Analytics Plus tab.
On the Analytics Plus tab, click View All.
In Tableau, navigate to the page on which the report you want to mark as favorite appears.
Select the star next to the report you want to mark as a favorite.
Note
It takes 24 hours for the link to the report to appear on the Analytics Plus home page.
All favorites are associated with usernames. For some reason, if you have to change your username, please be noted that all favorites will be lost and cannot be retrieved. Hence, it is recommended to note down your favorites list for mapping to the new username.
Clear a report as favorite
At the organization or center level, navigate to Data & insights > Analytics.
On the Analytics page, go to the Analytics Plus tab.
On the Analytics Plus tab, click View All.
In Tableau, navigate to the page on which the report you want to mark as favorite appears.
Clear the star next to the report. To do this, click the star so the color changes from grey to white.
Note
You may continue to see the reports because It takes the system 24 hours to refresh the Analytics Plus home page.
How to download reports
Learn how to download reports using Analytics Plus.
Analytics Plus: Fact, Dimension, and Calculated Fields
Fact/Measures: When you first connect to a data source, Analytics Plus assigns any fields that contain quantitative or numerical information (that is, fields where the values are numbers) to the Fact or Measures area in the Data pane.
Dimensions: When you first connect to a data source, Analytics Plus assigns any fields that contain discrete categorical information (for example, fields where the values are strings or Boolean values) to the Dimensions area in the Data pane.
Calculated fields: Fields where you define a formula based on existing fields and other calculated fields using standard functions.